Products
Resources
Company

April 25, 2017
2016 appears to have been a banner year for CEO pay, with a strong stock market elevating the value of pay packages. According to data collected for the Equilar 100—a study of the 100 largest companies by revenue to file proxy statements before April 1—CEO pay increased by 6% at the median. Total compensation—which includes stock and options grants at valued in their entirety—reached $15.0 million at the median for the CEOs in the Equilar 100, higher than any year since the study was initiated in 2013 as an early look into pay trends.
“Proxy season,” which spans the months of March and April, sees approximately 2,600 public companies file their previous year’s compensation data, with nearly half of those coming in the last two weeks of April.
Other analyses on this year’s Equilar 100 have touched on the highest-paid CEOs overall, as well as the difference between pay packages for males and females who lead the companies on this year’s list.
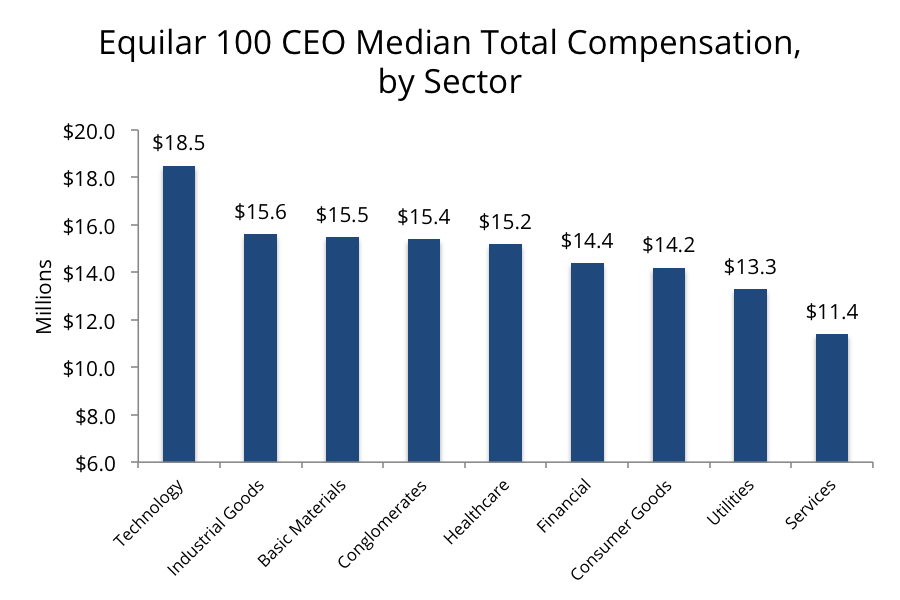
When breaking down by industry sector, technology CEOs once again were awarded the largest pay packages in the Equilar 100 study. The 12 companies assigned to that sector awarded a median $18.5 million to their top executives, approximately $3 million higher than the sector with the next-highest median.
Mark Hurd of Oracle was the highest-paid CEO in the tech sector, followed closely by his co-CEO Safra Catz, both of whom were provided with compensation worth approximately $41 million, as reported to the SEC. Meanwhile, Meg Whitman of HPE and Ginny Rometty of IBM each received pay packages worth more than $30 million in total value. The full list of tech CEOs included in the study is below.
| Company | Executive | Total Compensation | 2016 Revenue (MM) |
| ORACLE CORP | Mark V. Hurd | $41,121,896 | $37,047 |
| ORACLE CORP | Safra A. Catz | $40,943,812 | $37,047 |
| HEWLETT PACKARD ENTERPRISE CO | Margaret C. Whitman | $32,935,138 | $50,123 |
| INTERNATIONAL BUSINESS MACHINES CORP | Virginia M. Rometty | $32,307,434 | $79,919 |
| HP INC | Dion J. Weisler | $28,154,637 | $48,238 |
| AT&T INC. | Randall L. Stephenson | $24,959,412 | $163,786 |
| ACCENTURE PLC | Pierre Nanterme | $18,499,843 | $34,798 |
| MICROSOFT CORPORATION | Satya Nadella | $17,692,031 | $85,320 |
| VERIZON COMMUNICATIONS INC | Lowell C. McAdam | $17,441,424 | $125,980 |
| CISCO SYSTEMS, INC. | Charles H. Robbins | $16,034,571 | $49,247 |
| QUALCOMM INC/DE | Steve Mollenkopf | $11,066,012 | $23,554 |
| JABIL CIRCUIT INC | Mark T. Mondello | $10,518,414 | $18,353 |
| APPLE INC. | Tim Cook | $8,747,719 | $215,639 |
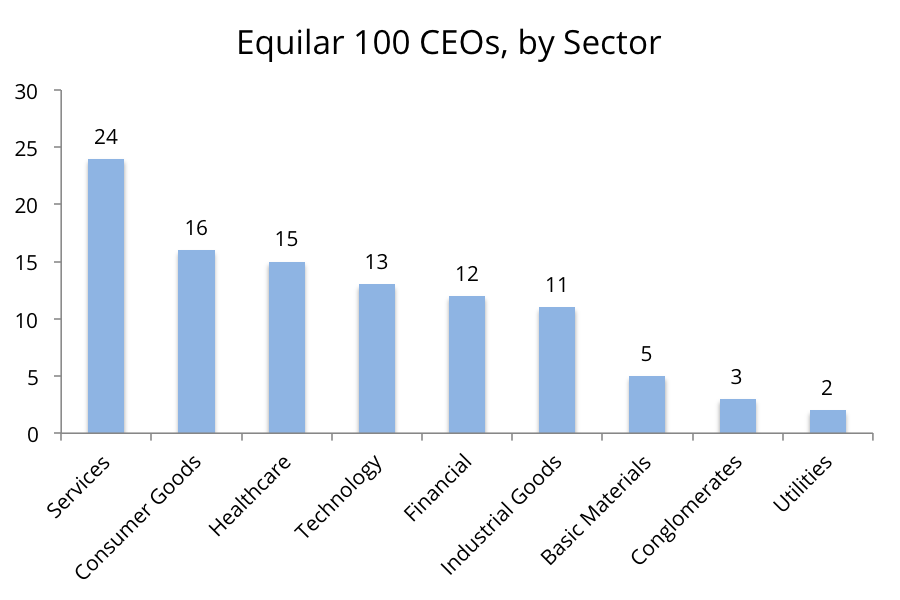
Overall, every major sector was represented in the study, and the services sector was the most highly represented with 24 companies. That includes a wide range of companies from retailers to coffee chains to distributors. The sector also awarded the widest range of pay packages, while maintaining the lowest median at $11.4 million. Sixteen of the 24 CEOs in this sector were below the median for the overall study. By contrast, only three of the 12 tech CEOs were below the median, and six were awarded $25 million or above.
As the Equilar 100 is a study of company revenue as well, one notable trend was that all five basic materials companies—each in the oil and gas business—lost double digit revenue in 2016. Of those five CEOs, only one saw an increase in total compensation awarded—Joseph Gorder from Valero—whose total compensation increased in value 6% from fiscal year 2015. Revenue for the company decreased 14%, and total shareholder return was flat.
Gorder’s pay, while also certainly subject to circumstances unique to the company, brings to light an important caveat when comparing company performance disclosed in an annual filing vs. pay reported for that fiscal year as is required by the SEC. Revenue and TSR in this case are year-over-year changes measured at the end of the year, and pay is awarded much earlier in the year. As such, if performance was down last year, pay reported in 2017 (in the form of a bonus or other performance awards) would likely be more closely connected to last year’s revenue.
In addition, since the SEC requires companies to report the full value of any equity grant on the day it was awarded, a three-year long-term incentive plan that is contingent on future performance may not ever be fully paid out. As a result, the figures that show up in the annual proxy are less about how much an executive is pocketing, but more so a reflection of the company’s future strategy and how they are incentivizing their leadership.
For information regarding the studies referenced in this post and to purchase the underlying datasets, or to learn more about Equilar Research Services, please contact the Equilar research team at researchservices@equilar.com.
For more information on Equilar research and data analysis, please contact Dan Marcec, Director of Content and Communications—who also authored this post—at dmarcec@equilar.com.


Subscribe to our Newsletter to stay informed about upcoming events and webinars.