Products
Resources
Company
Over the years, human resources (HR) became a vital department for companies that are looking to protect themselves from criticism in the world of corporate governance. The chief human resources officer (CHRO) grew into a pivotal role within corporate boardrooms, shouldering the responsibility of ensuring that corporate culture remains optimal. The CHRO assists the board of directors in designing compensation programs that align with company performance goals, ensuring that employees are trained in putting a company’s values to practice in their work and monitoring hiring practices to ensure that they are retaining the best possible talent for their respective industries.
Given the growing scrutiny that companies are facing today, it is more important than ever that companies retain the best CHROs to proactively manage company culture, and to monitor pay for performance alignment to appease vigilant shareholders. As a result, CHRO compensation continues to grow, and these executives find themselves in a better position to obtain the status of named executive officer (NEO), whose total compensation is publically disclosed each year due to SEC regulations.
In order to get a comprehensive picture of HR pay trends in the past year, Equilar relies on two sources of information to create the Equilar TrueView methodology: proxy data of the top five NEOs and Equilar Top 25 survey data. By combining these two sources, Equilar captures a spectrum of compensation details for CHRO roles, from companies who place a greater emphasis on the role by making their CHRO an NEO position, to others whose organization requires that other senior executive roles have higher total direct compensation (TDC). TDC combines fixed and variable compensation by adding up base salary, the target value of incentive awards and the value of any equity awards (measured by grant date fair value). In this report, “stock” refers to both stock and units, whereas “options” refers to both stock options and stock appreciation rights.
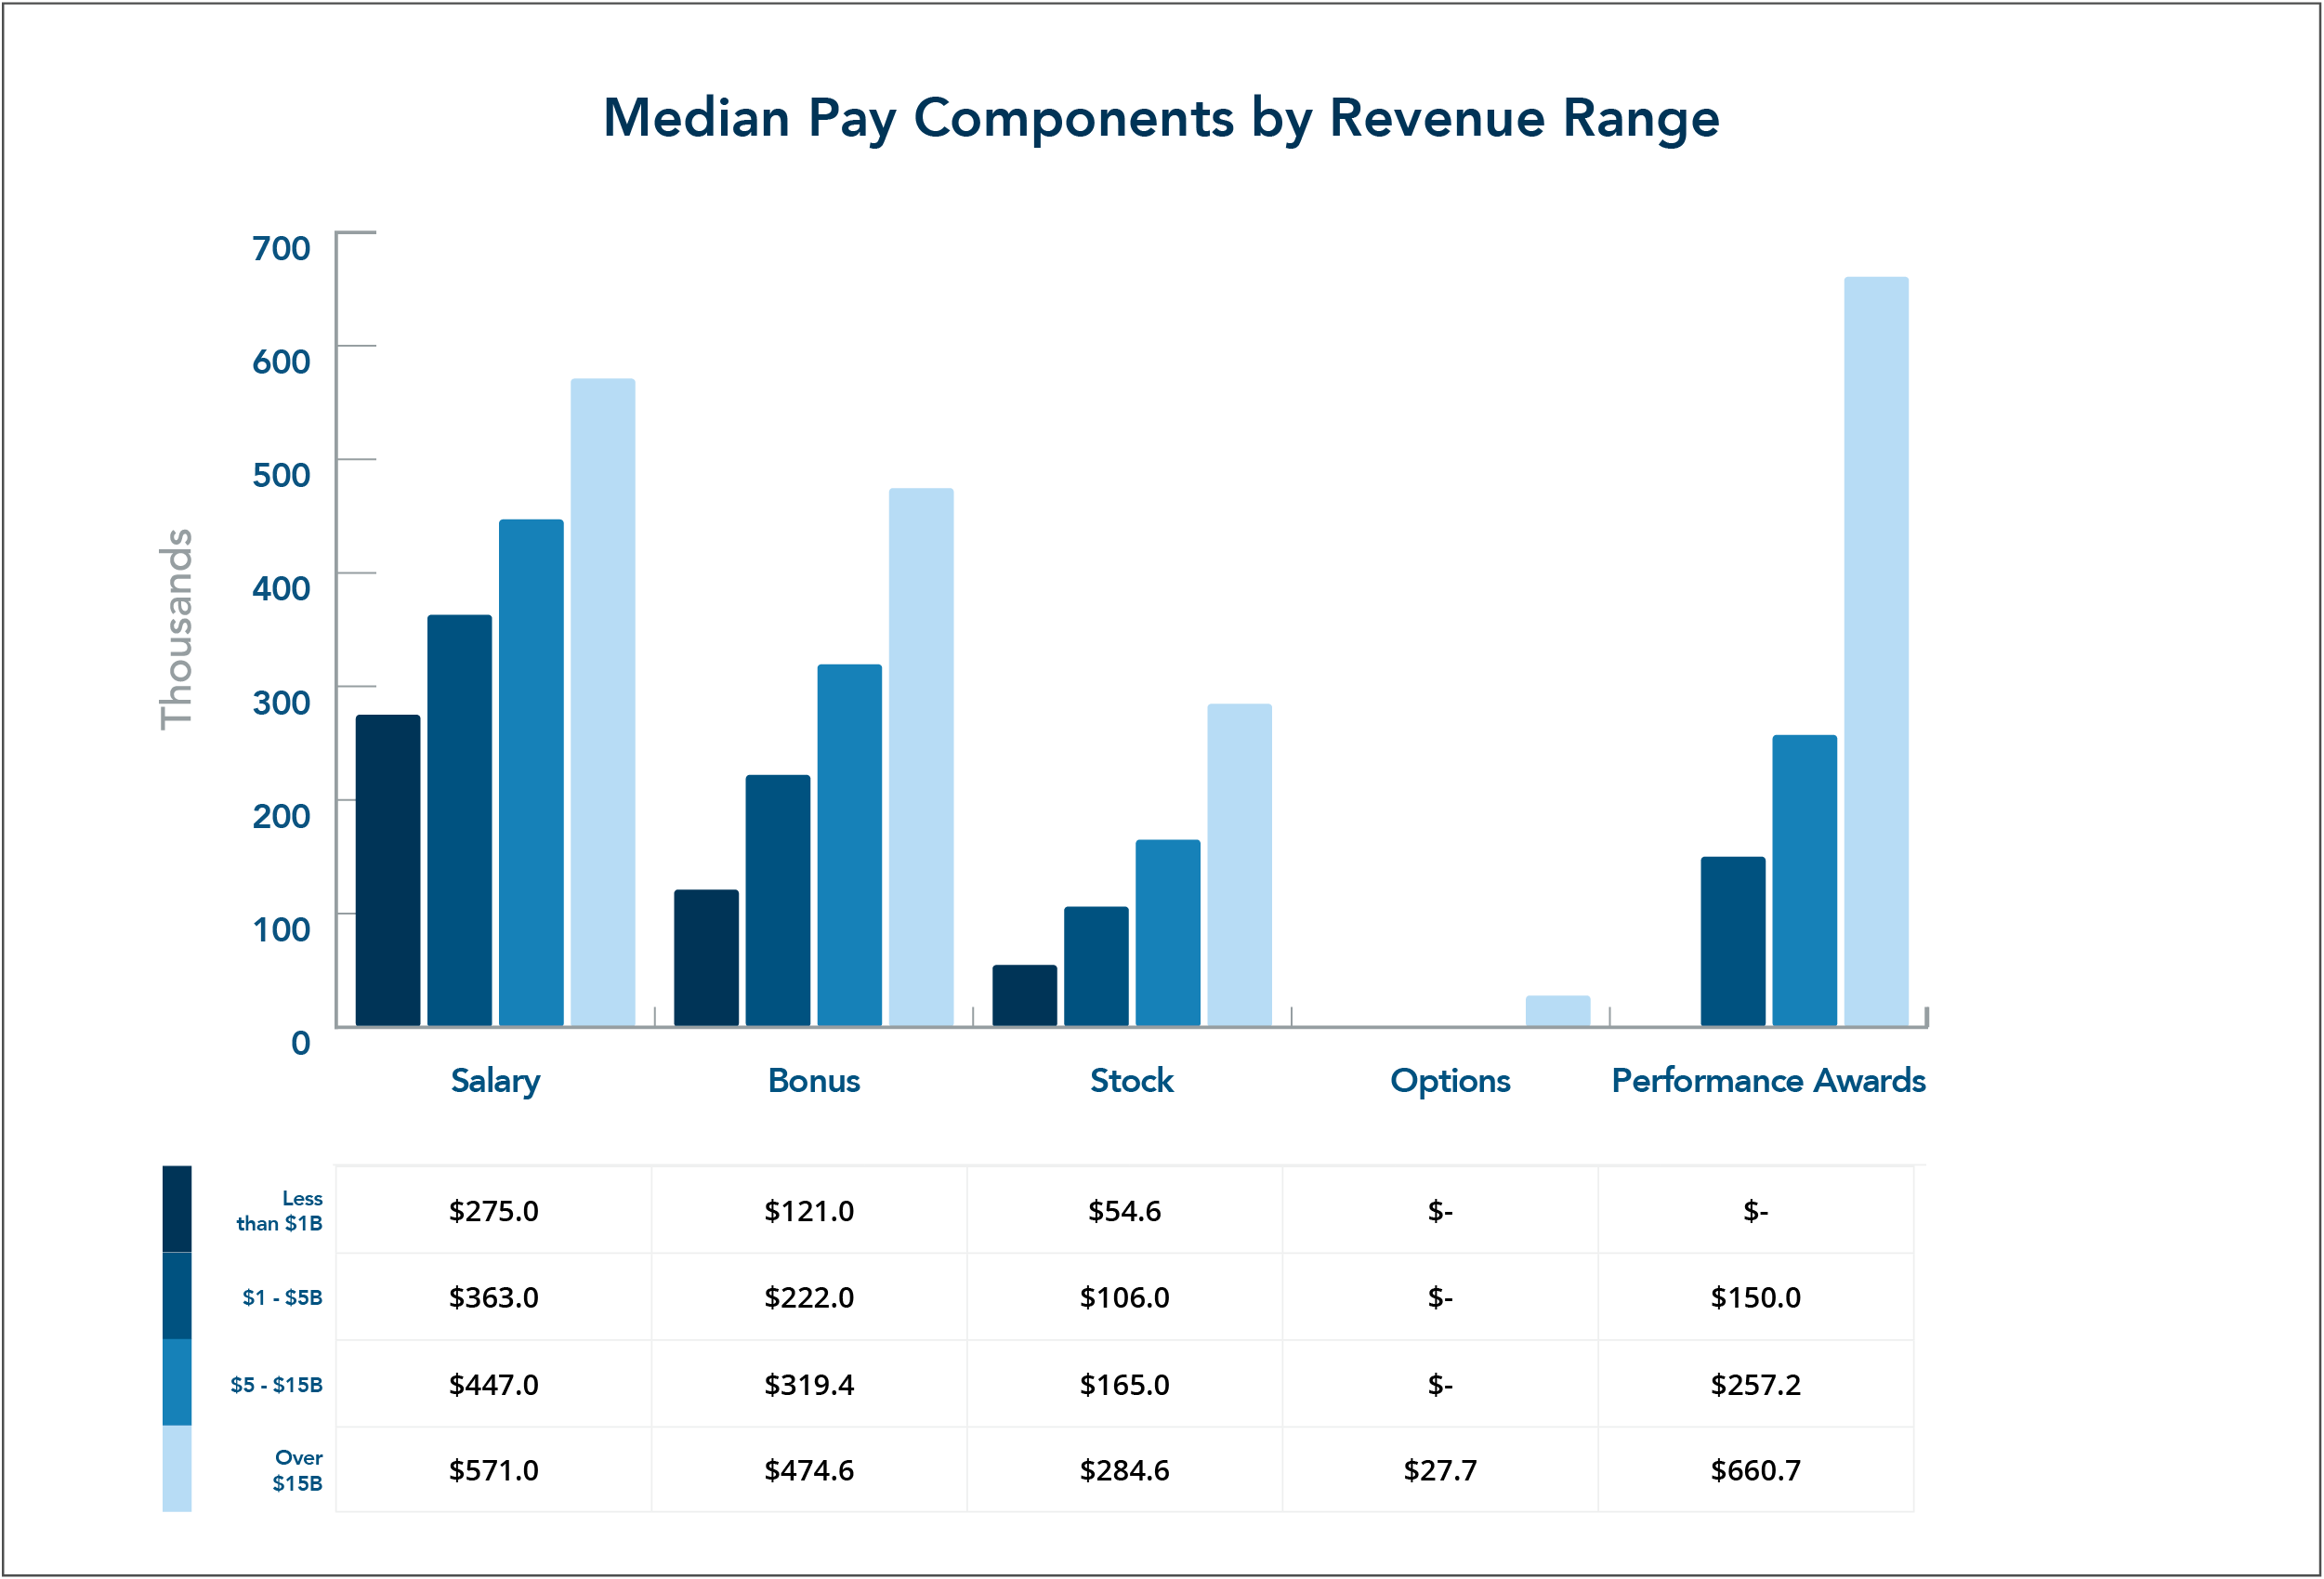
Figure 1
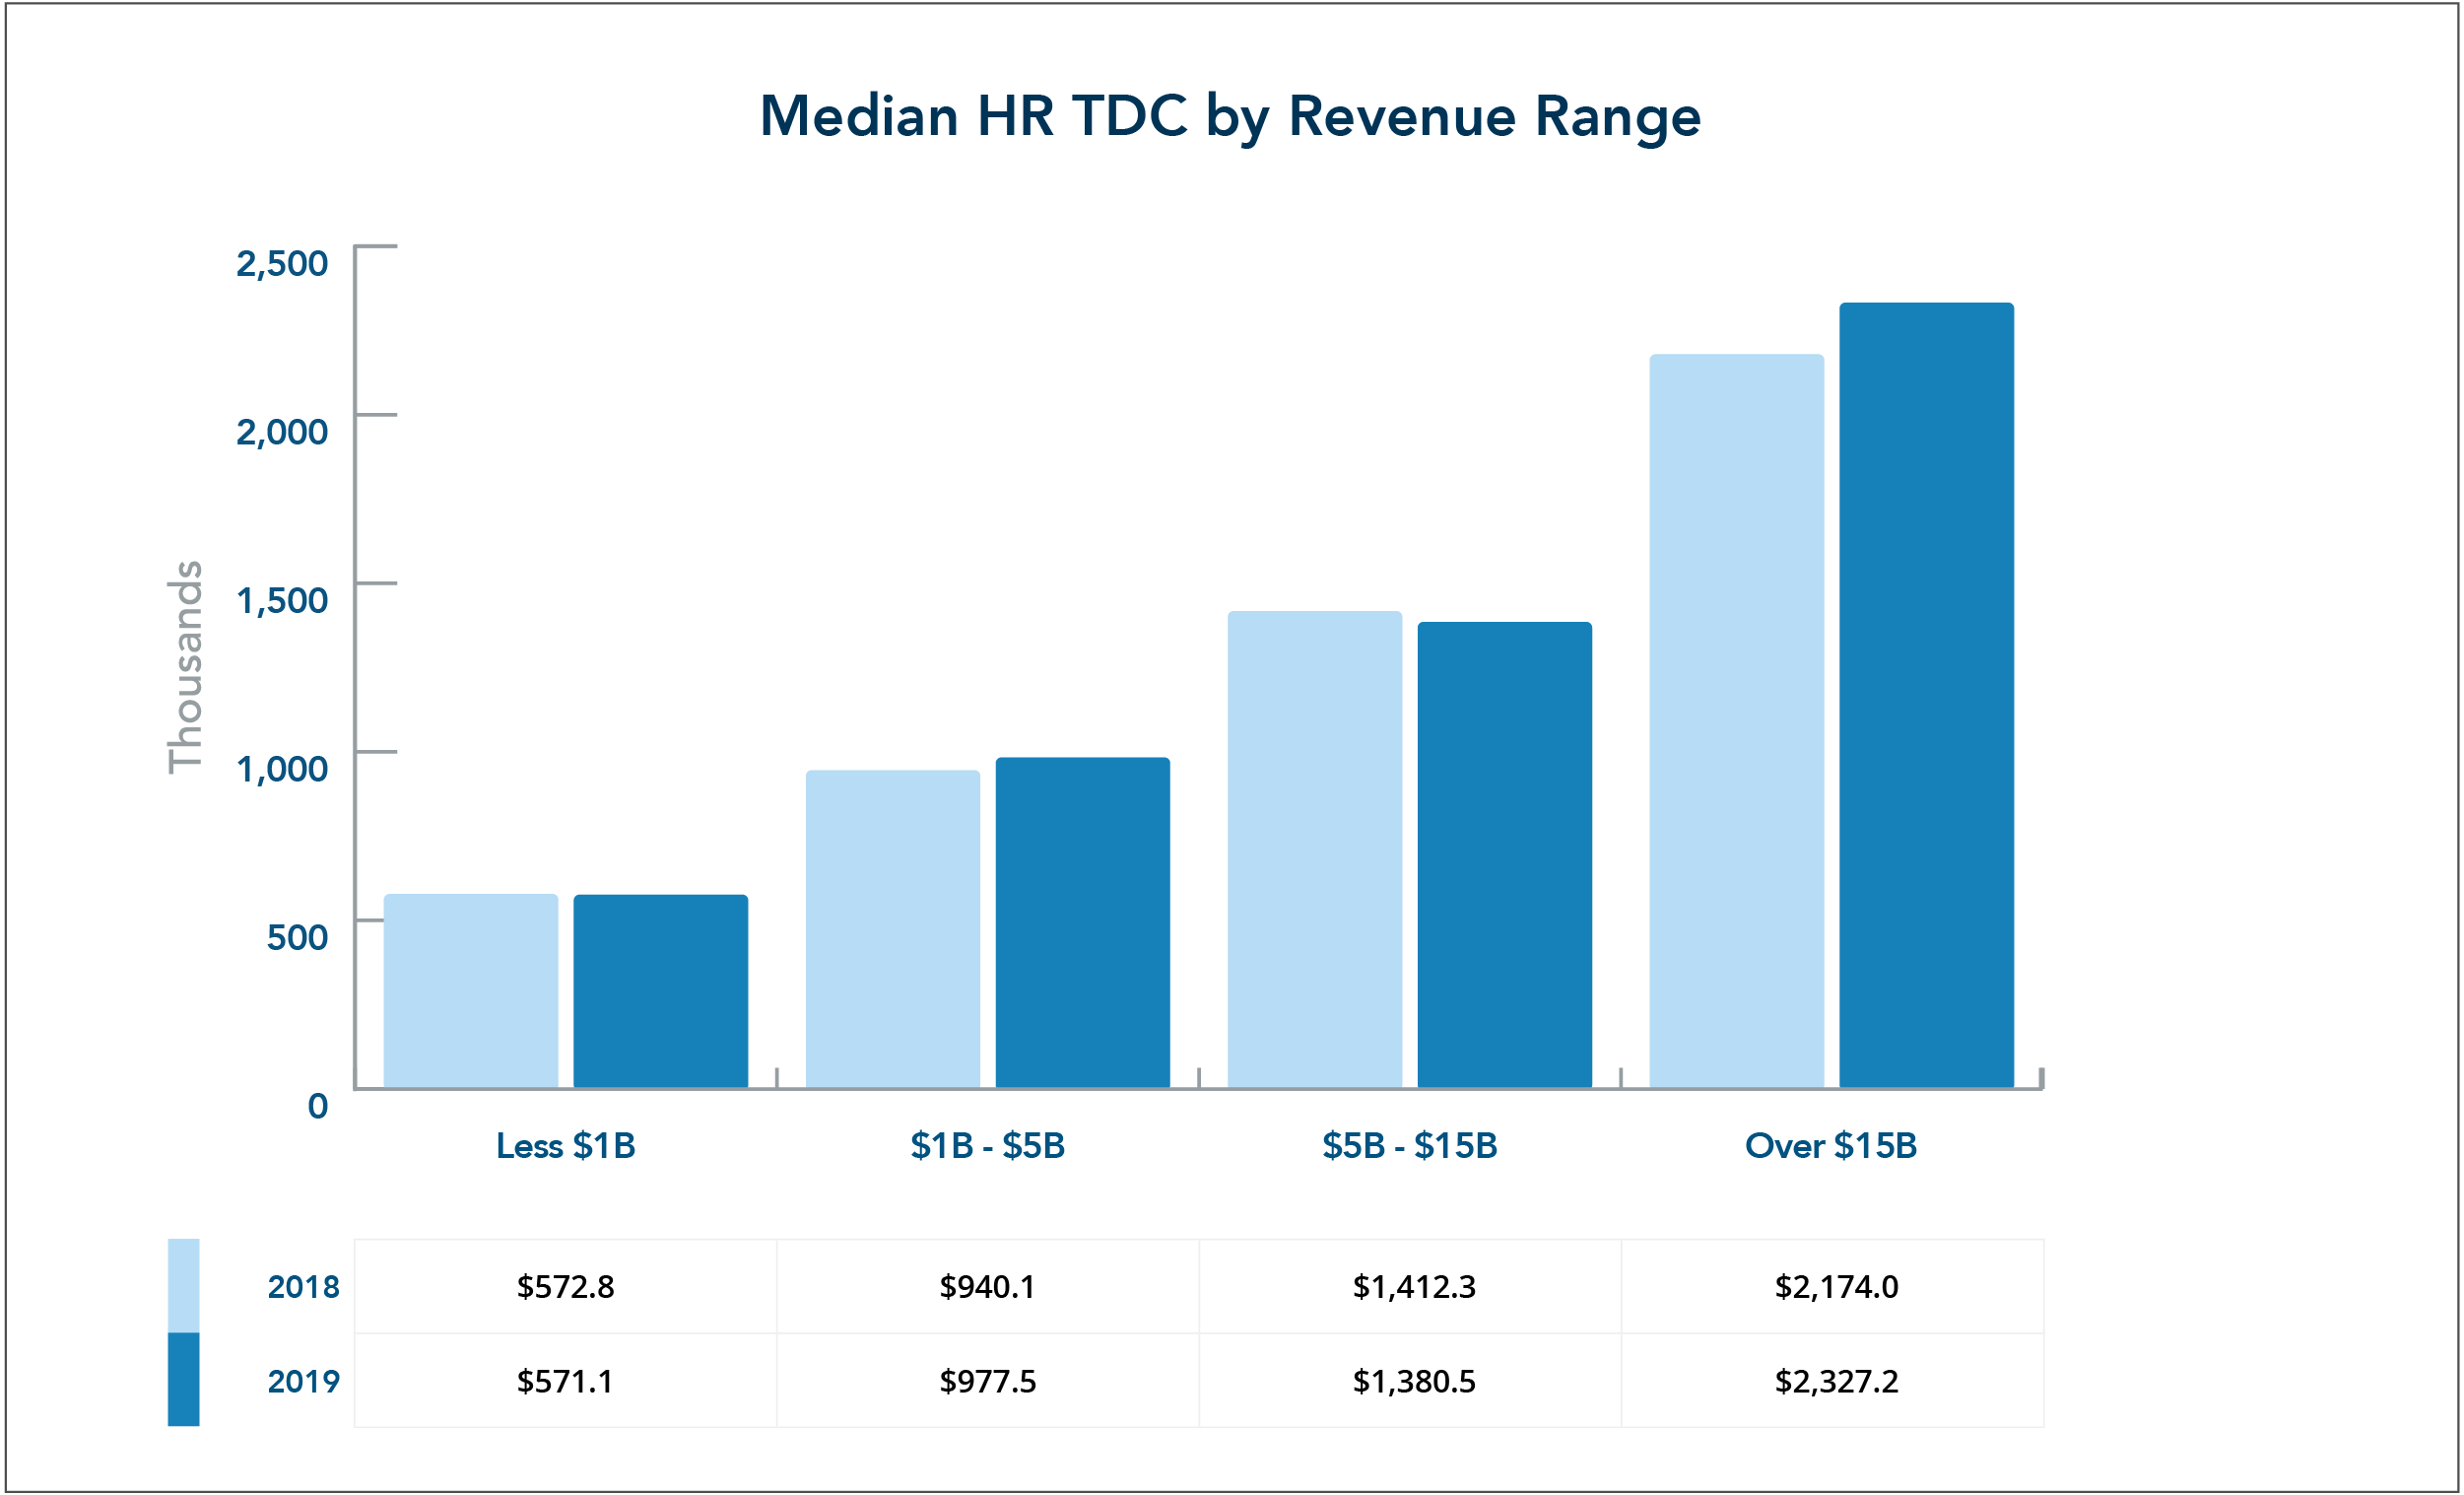
Figure 2
In figure one, compensation increased from 2018 and 2019 for companies with revenue between $1 and $5 billion, and for those with greater than $15 billion. Compensation grew by about 4.0% at companies between $1 and $5 billion in revenue, and by about 7.0% for companies above $15 billion. While companies across the board are attempting to attract talent in the HR field, it appears that the largest U.S. companies with large employee populations are putting the most resources into compensating their HR executives. This movement is an interesting change from last year’s report, where the over $15 billion range was the only bracket that decreased in median TDC year-over-year.
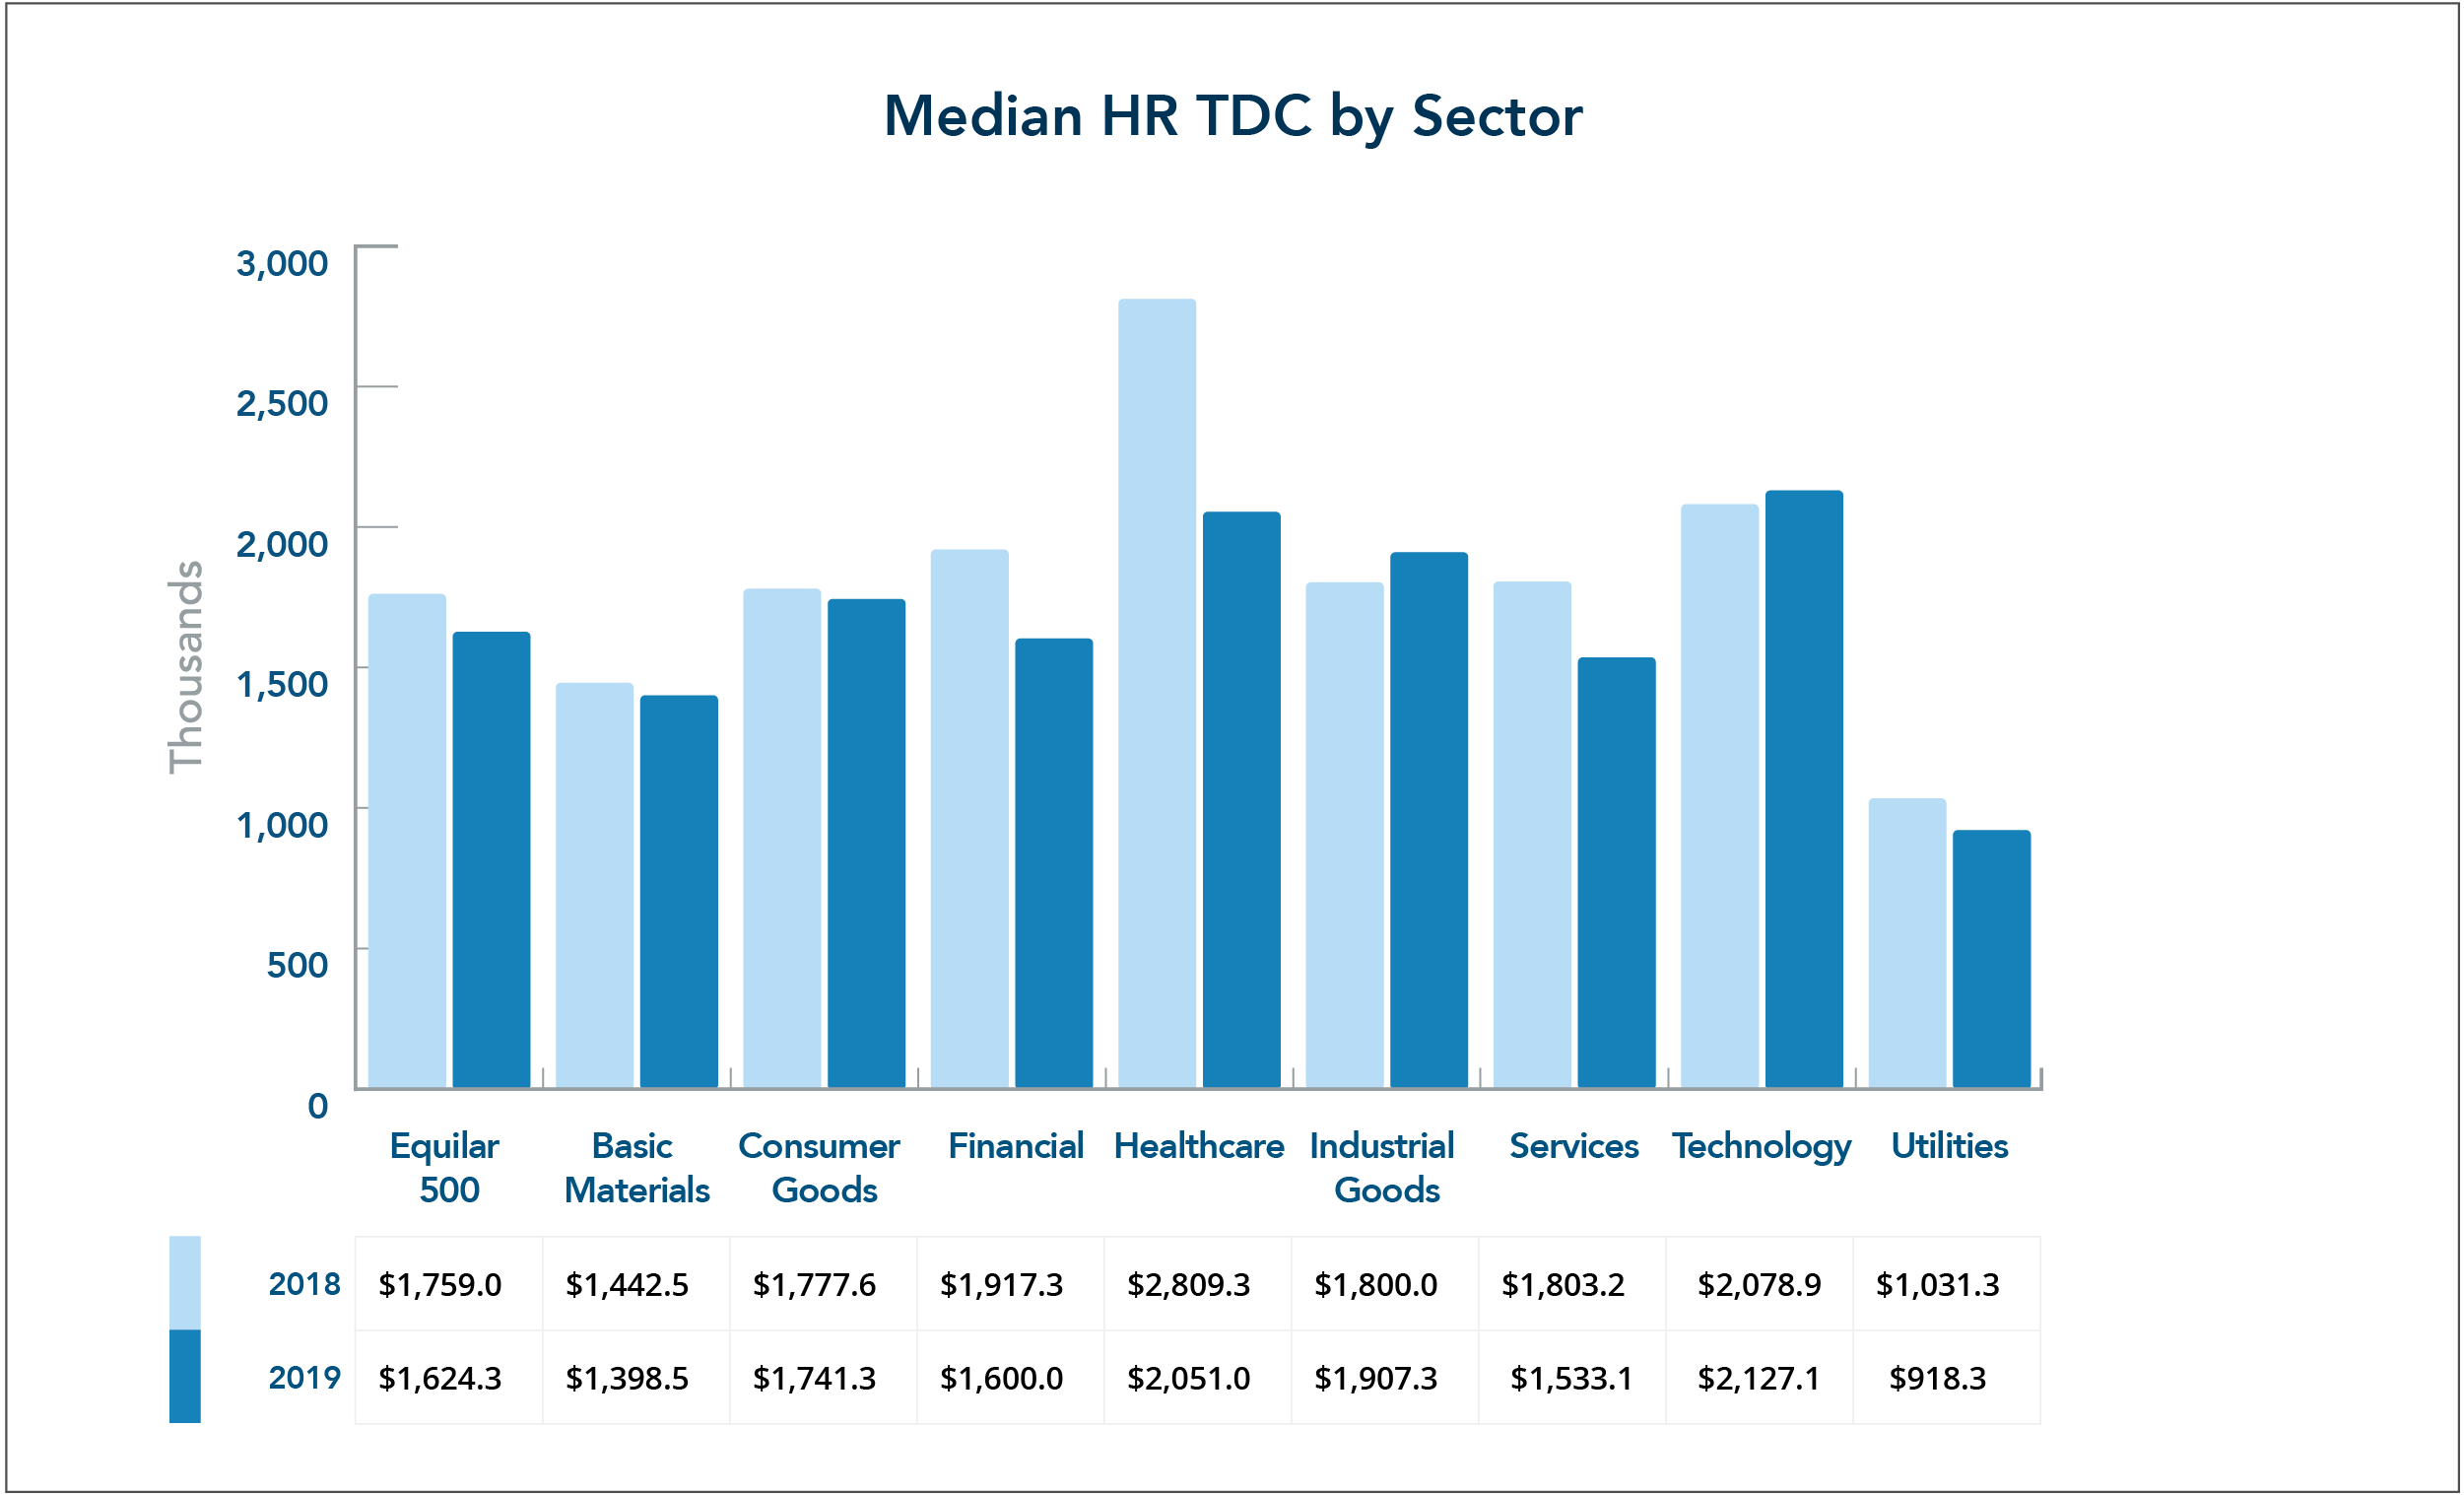
Looking at changes to total direct compensation by sector provides a more detailed view of these changes compared to the macroscopic lens of dividing companies by revenue range. This year saw shrinking compensation in every sector besides industrial goods and technology, where median TDC grew by 6.0% and 2.3%, respectively. The healthcare sector saw a dramatic 27.0% drop in TDC from 2018 to 2019, with the median amount falling from $2,809,278 to $2,050,950. The financial, services and utilities sectors also saw significant decreases in median TDC, at 16.5%, 15.0% and 11.0%, respectively. The Equilar 500—a list of the 500 largest U.S. based companies by revenue—saw a 7.7% decrease in median HR TDC.
Figure 3
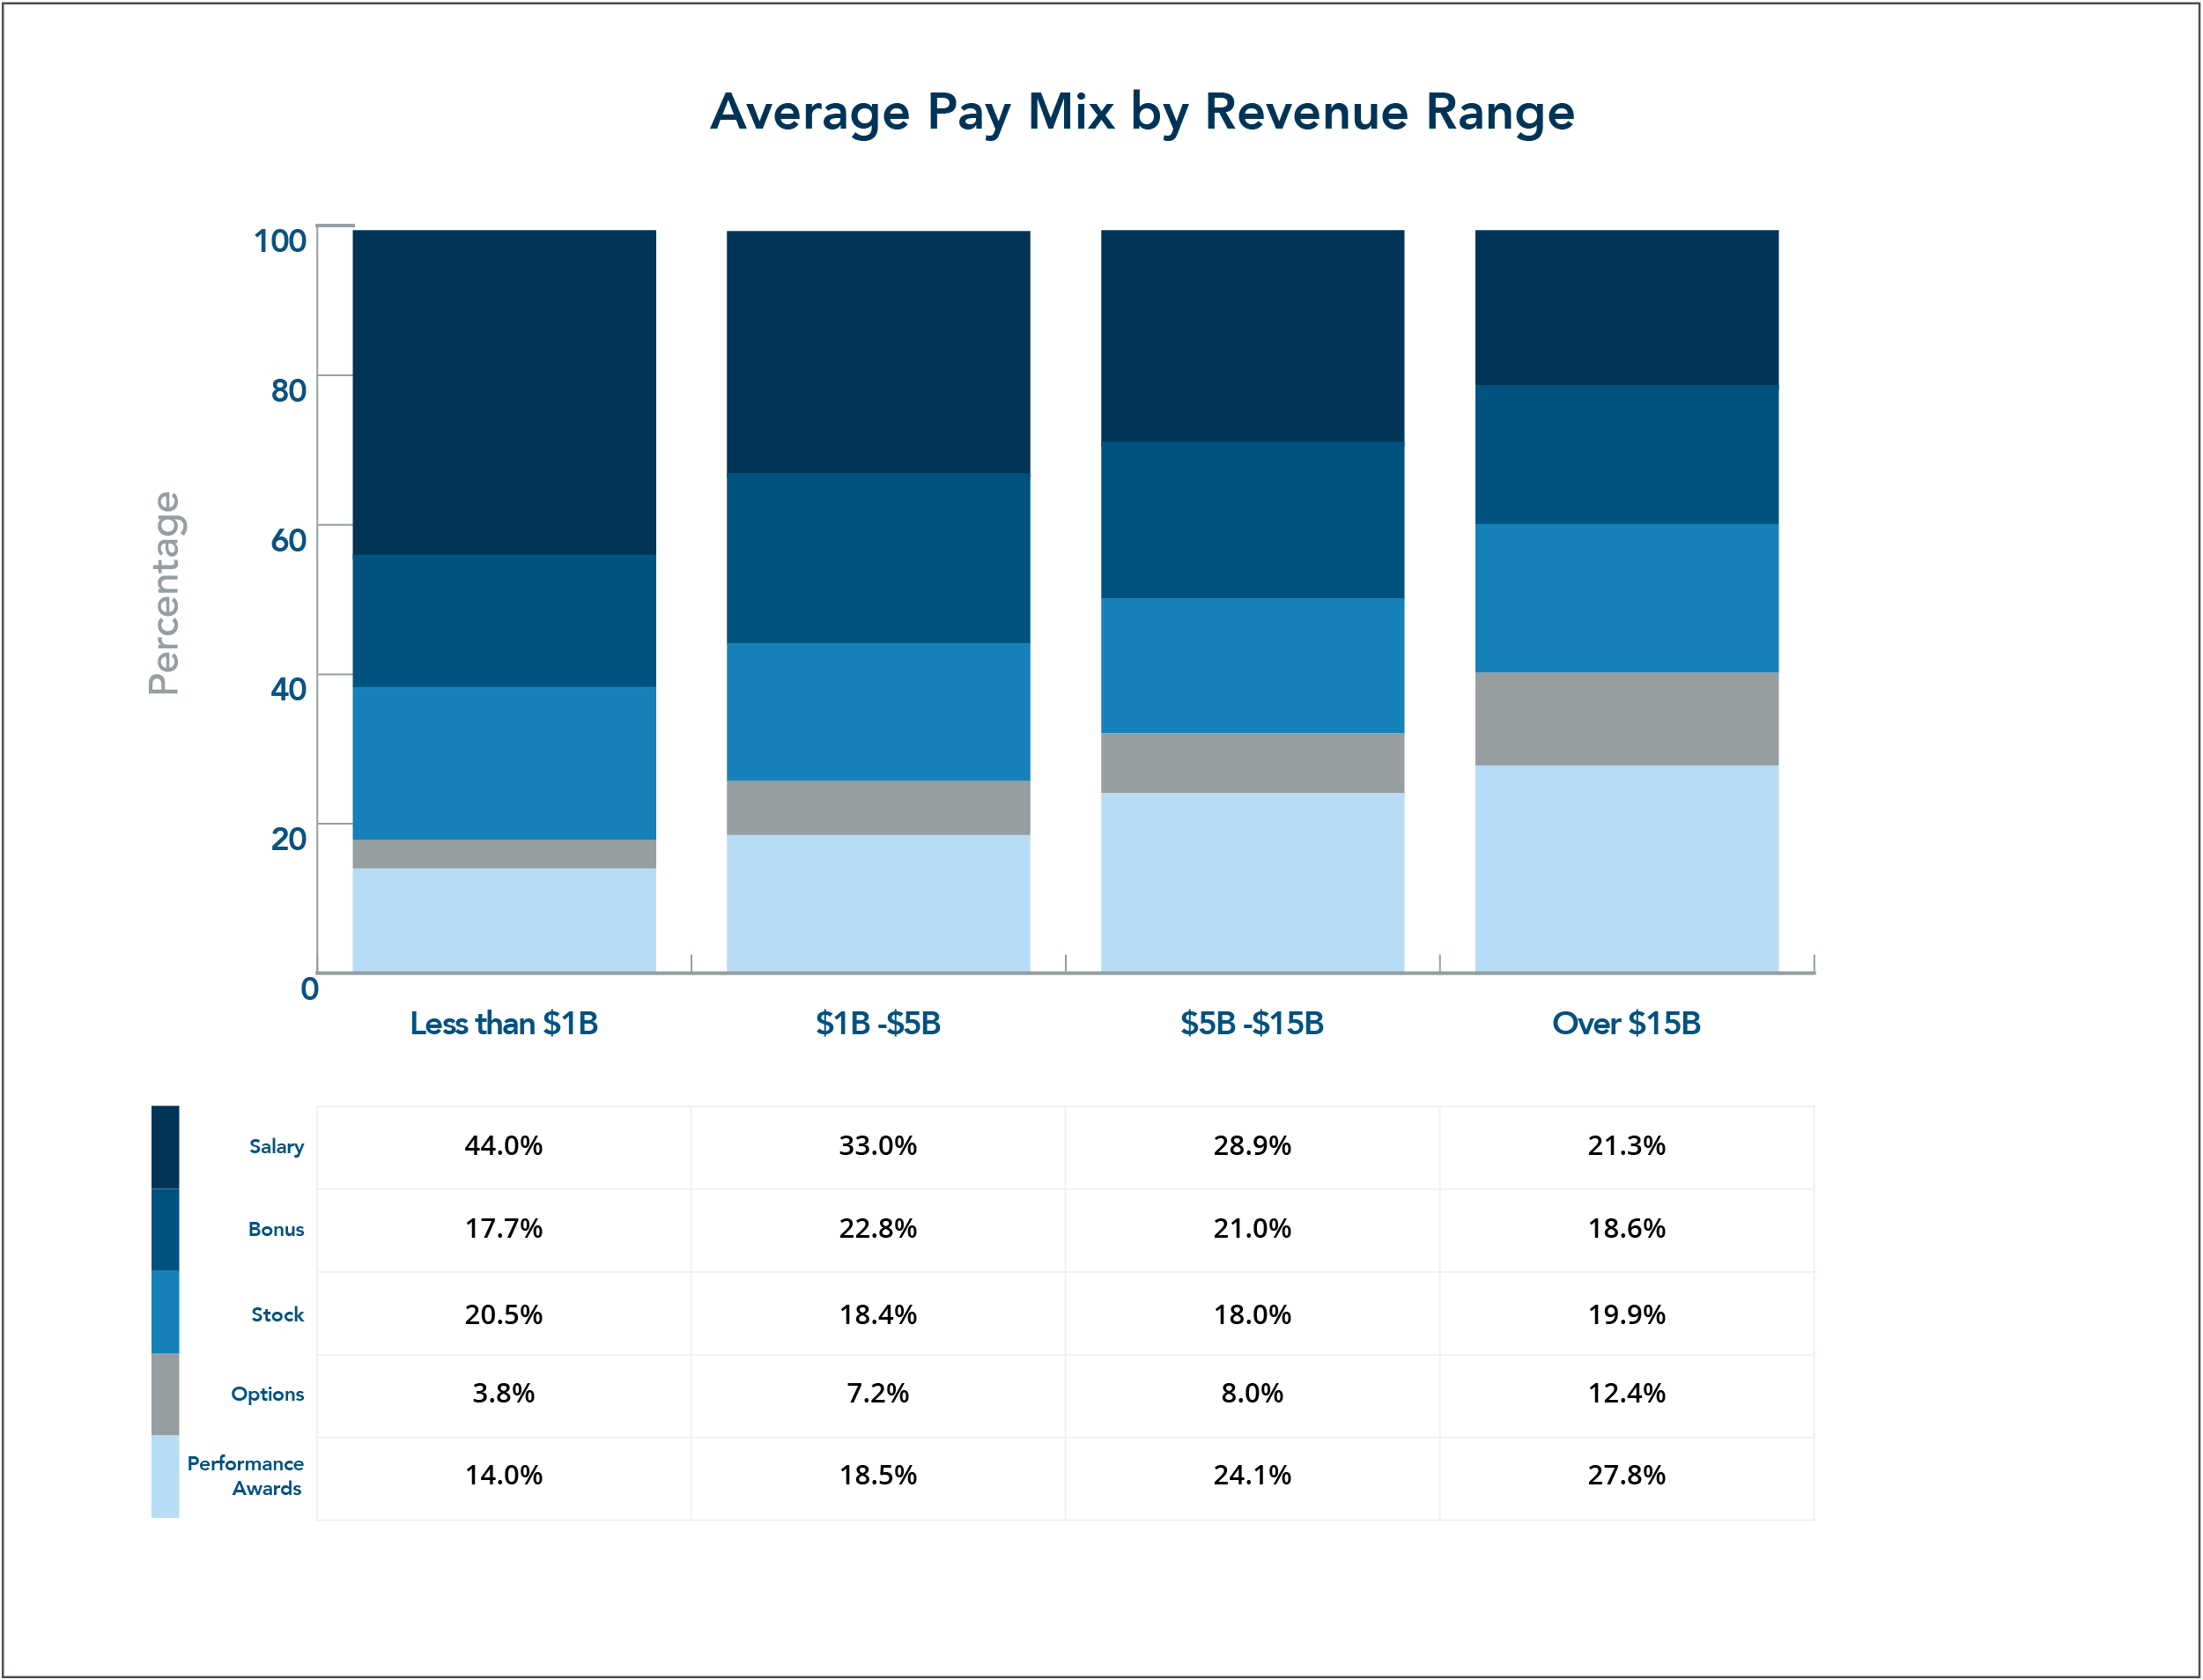
Comparing companies with less than $1 billion in revenue to those with revenue greater than $15 billion, performance contingent compensation vehicles become much more prevalent in overall compensation packages for senior HR executives, as fixed compensation becomes a smaller component of the total pay package. For the largest companies, it is becoming more crucial to tie HR executive compensation to key performance outcomes, as they take on a growing set of responsibilities in relation to changes in corporate governance practices. The clearest example of this trend is the difference in salary: salaries represent 44.0% of TDC for HR executives at companies with less than $1 billion in revenue, but only 21.3% in companies over $15 billion. This disparity is further displayed in the changing value of performance-based long-term compensation, which grows from 14.0% of TDC at companies with revenue less than $1 billion to 27.8% of TDC at companies with revenue greater than $15 billion.
Equity awards that are contingent on performance are extremely important to large public corporations, as they face greater attention and scrutiny from investors who want to see how executive pay relates to company performance. The relative value of time-based stock awards remained consistent across all four revenue ranges, at a range of approximately 18-20% of total direct compensation. Options, on the other hand, make up a significantly greater portion of TDC for companies in the highest revenue range, jumping from 3.8% to 12.4%.
Figure 4
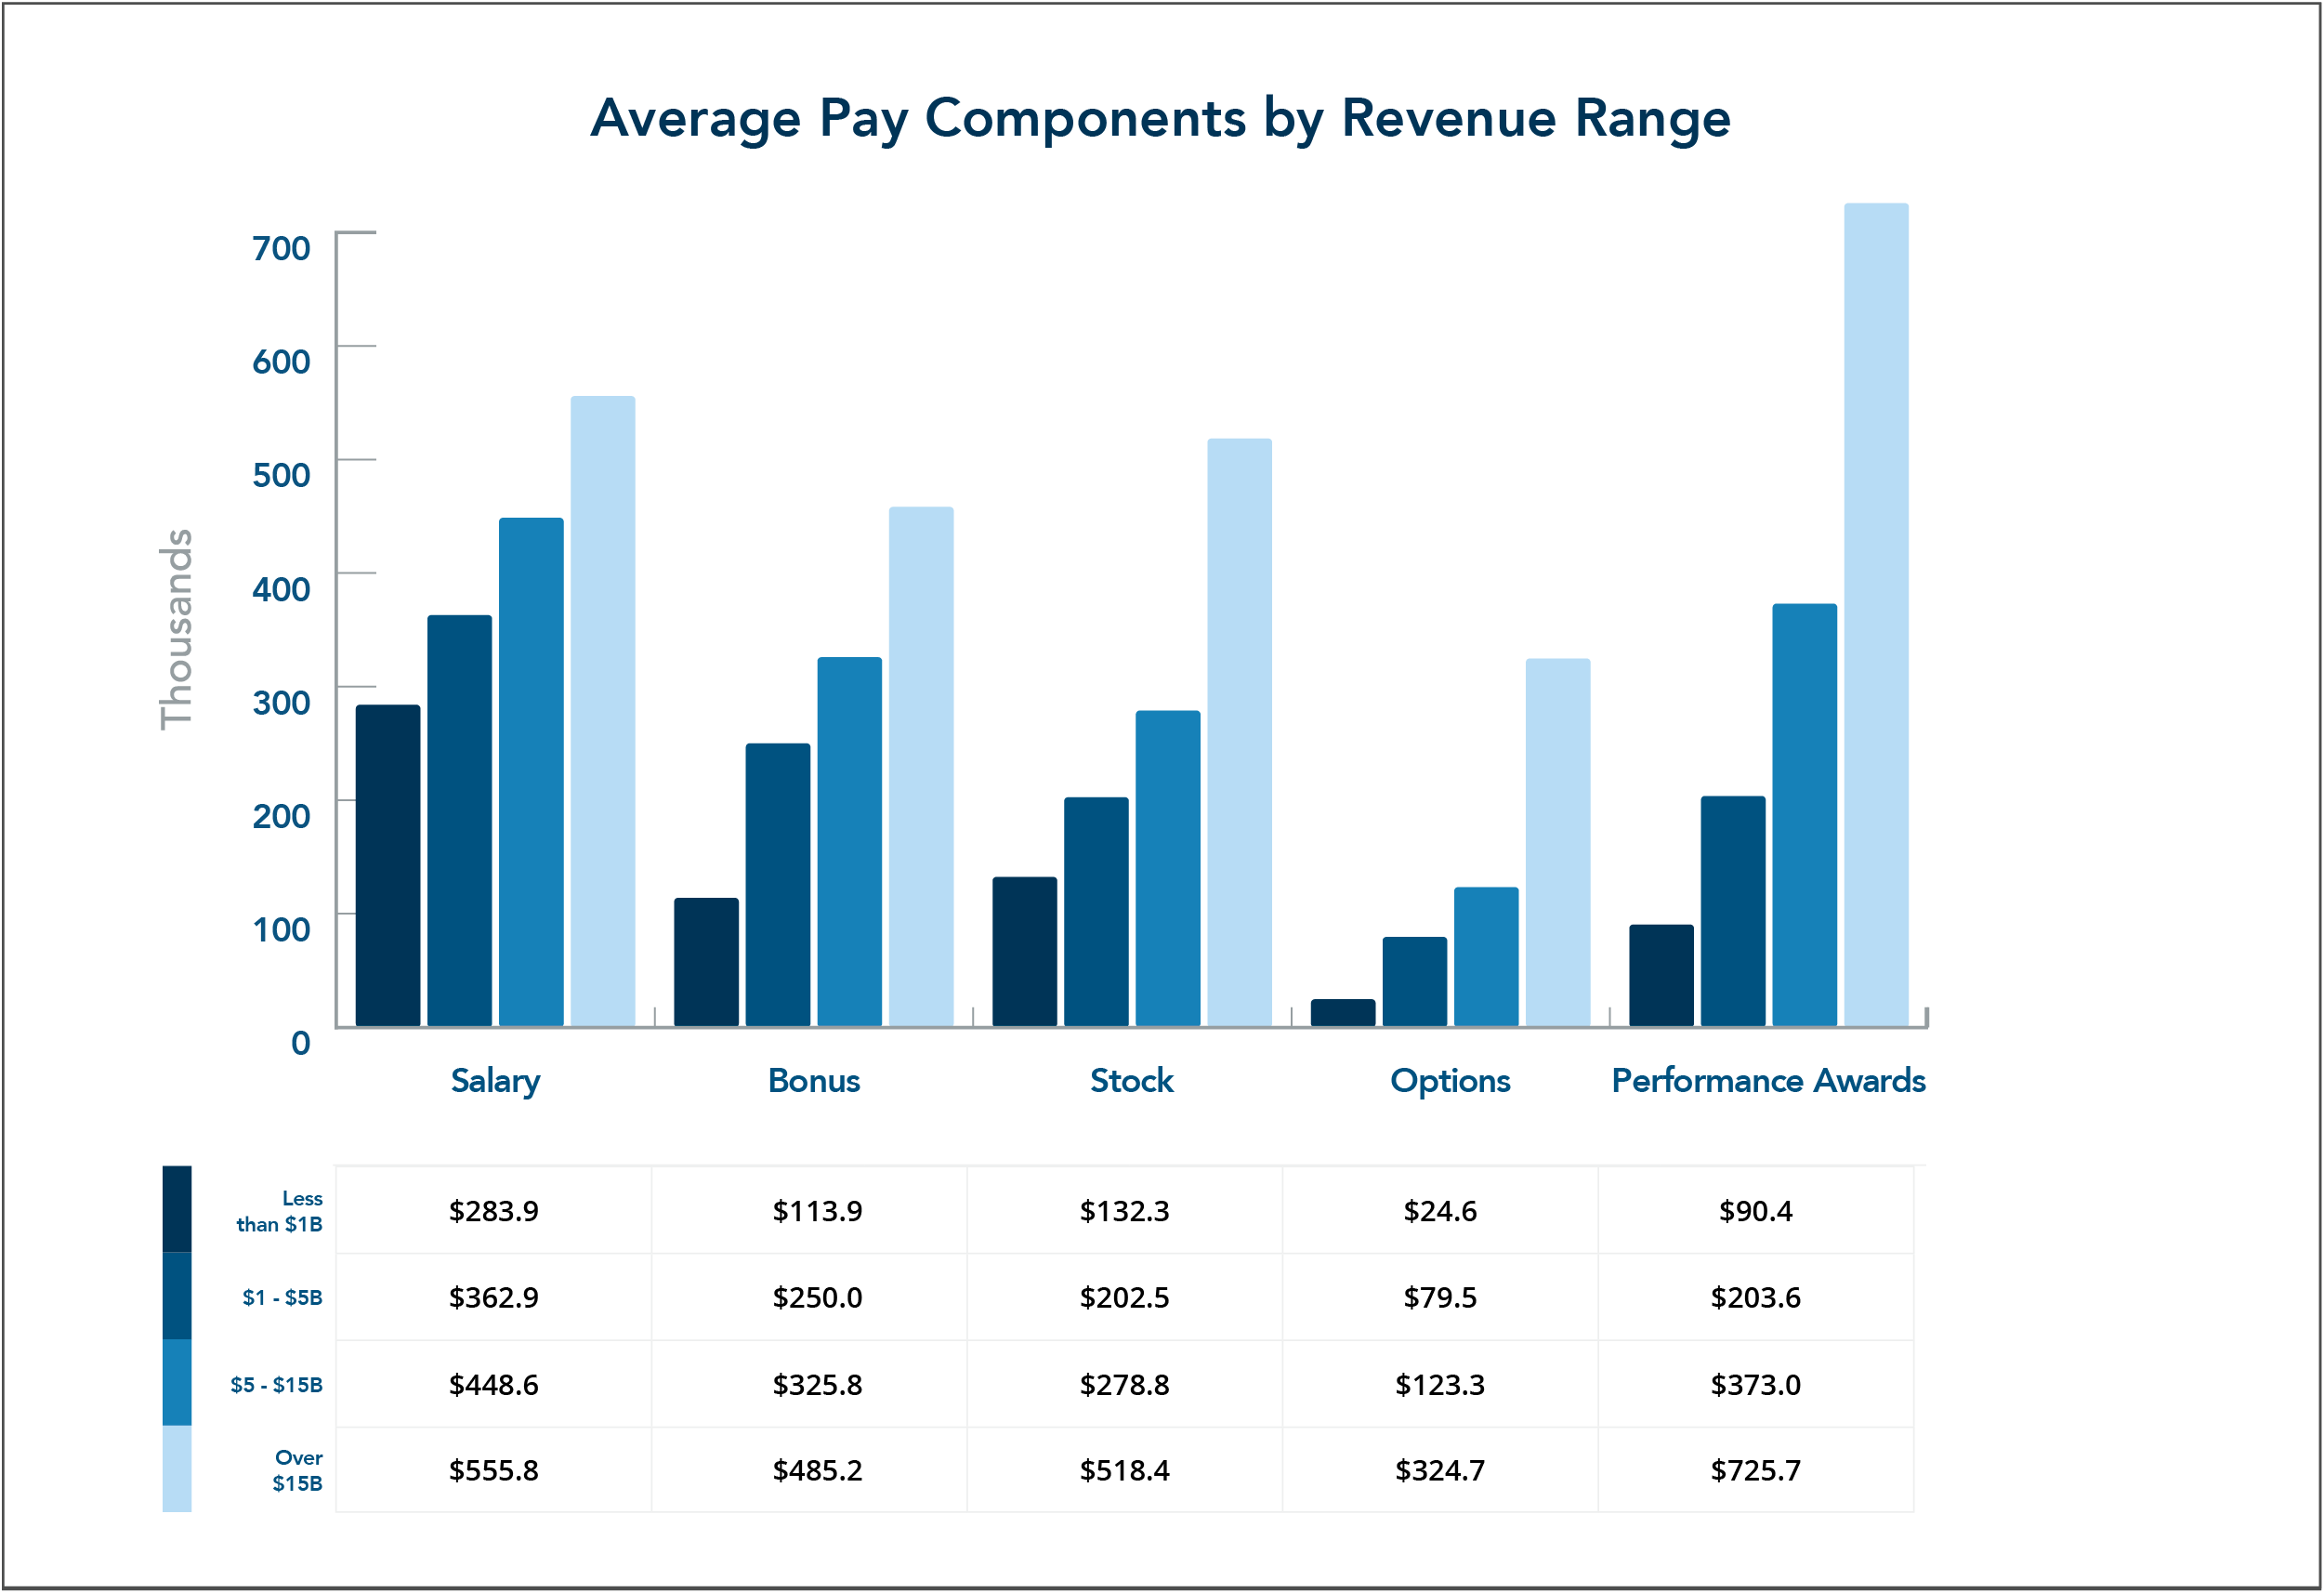
Figure 5
These trends become more visible when looking at the average pay mix in dollar amounts. In figure four, the value of options in the highest revenue range is more than 1222.2% of the options value in the smallest revenue range. Long-term performance based awards also have a significant increase from the smallest to largest companies, jumping from $90,354 to $725,741. The overall change from the smallest to largest revenue range is a 304.6% increase in TDC, going from $644,990 to $2,609,851. While the figures don’t change to the same degree, the median pay components graph shows similar growth of each pay component between revenue ranges. This suggests that while there is some drop off in proportional increase when comparing TDC changes to company revenue changes, there is a clear correlation between the size of a company and the value of HR executive pay packages, as these executives face greater challenges managing a significantly larger employee population.
At smaller companies, HR executive compensation programs can rely on more conservative pay packages that more heavily feature fixed-pay components, like salary and time-based equity awards. As a company grows in terms of revenue and employee count, the total compensation of the CHRO and other HR executives will grow to account for the significant responsibility that these executives take on. Performance equity becomes more essential for these larger companies, as compensation committees seek to justify their pay decisions to critical investors who approve pay packages through Say on Pay votes.
Given the highly critical nature of shareholders and media outlets today, the value of talented HR executives should not be understated. These pay packages continue to grow, despite investor scrutiny, to ensure that HR executives are properly motivated to protect their companies from crippling damage to brand reputation that can arise from a public scandal. With this growing responsibility, comes an opportunity for CHROs to grow in corporate prestige, and to be featured more frequently at the NEO level.
Please contact info@equilar.com to request a sample TrueView report or to learn more about Equilar data and research.

Connor Doyle, Research Analyst, authored this post. Kathleen Eberle, Nathan Grantz and Matthew Listi contributed data and analysis. Please contact Amit Batish, Content Manager, at abatish@equilar.com, for more information on Equilar research and data analysis.

Subscribe to our Newsletter to stay informed about upcoming events and webinars.