Products
Resources
Company

Historically, executive compensation had been largely evaluated, analyzed and planned through complex calculations mostly done by hand. No one is reaching for an abacus or a TI-83 calculator in 2021, as the internet and cloud computing have opened access to massive amounts of data. Yet, data analysis for compensation planning today remains surprisingly manual.
Shelly Carlin, Executive Vice President of the Center On Executive Compensation, a division of the HR Policy Association, joined Equilar for a recent webinar to discuss how data and analytics are helping compensation planners make better, fact-based decisions while strengthening the relationship between HR leadership and the board of directors’ compensation committee.
In particular, executive compensation planners are constantly evaluating whether the performance metrics they’re using for incentive plan design are still the most relevant ones, and whether their peer companies are using metrics they may wish to consider for themselves.
Enter the Incentive Plan Analytics Calculator, or IPAC, which Equilar and the Center jointly conceived to help compensation planners facilitate a deeper assessment of incentive plan awards, understand what awards might be appropriate within a specific peer group context, what metrics peers are using with respect to short- and long-term awards, where should targets be set most appropriately, and much more.
“The more data we have, the more apparent it becomes that to be an effective practitioner in this field you are going to raise your game by understanding financial metrics and statistics,” said Carlin, who co-developed IPAC with Equilar. “We all know that executive compensation, and incentive design specifically, can be fraught with conflict and controversy, and it really helps you level the playing field when you can bring it back to a fact-based discussion.”
Within the tool, Equilar has done the work of organizing data on metric prevalence across proxy-disclosed peer groups, but IPAC also allows a user to incorporate any set of custom peers. The example below shows the prevalence of incentive plan metrics used in short-term awards and long-term awards, or in some cases both, for Walmart’s peer group in 2020.
“If you’re one of the practitioners used to gathering this information manually from proxy statements, I know that you’ll see you’re already saving potentially hours of work,” said Shane Carroll, manager of strategic partnerships for Equilar.
Navigating the Complex World of Payouts and Weightings
As companies go further in depth with their compensation plans, they may find themselves asking how peers’ awards are actually structured, as well as how awards are assigned to incentives and how that relates to payouts across the peer group. As greater complexities are introduced to executive compensation plans with respect to payouts and weightings, companies will need more robust ways to analyze and compare this information.
“These new enhancements in the past few weeks really have been on our minds since the original tool was launched,” said Carroll. “It’s been a very common request of our research team to dig into the finer points of incentive plans to understand weightings and definitions for individual metrics, and how payouts for performance play out at the individual company level.”
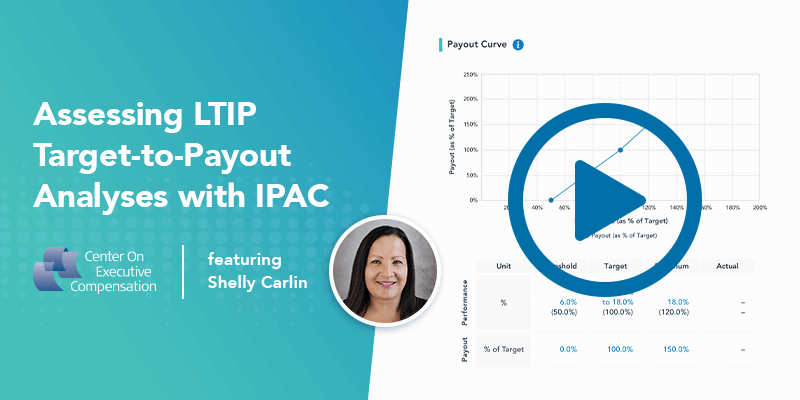
In the short clip from the presentation below, Carroll shared an example where Home Depot granted two separate awards. The results from the Payouts and Weightings tool show not only the metrics the Company is using, but also the full definition that’s disclosed within the proxy, with details on how that is weighted compared to other metrics assigned to the same award. This provides the ability to calculate a payout curve, showing actual targets, threshold and maximum performance, alongside a list of peers where pay plans can be compared directly.
Here, the short-term awards for Home Depot show their actual level of performance for inventory management was above 100% of target, resulting in the maximum payout. It’s possible to click through each independent metric as well.
“There is so much data here that you could get excited about, but particularly with this payout curve, look how narrow this range between threshold and maximum is,” said Carlin. “That doesn’t surprise me in a COVID year, since it was a weird year, but you could go through your competitors and really understand what that can tell you. If they are having such a narrow band around the target, they must be pretty confident about the outcome they’re going to get, whereas a really wide range might tell you something else.”
“This gives you business intelligence as well as incentive design information,” she added. “We’re just scratching the surface of how this data can be used, and when people get this data in their hands they’ll have opportunities to use it in ways we didn’t even think of.”
Compensation Metrics: What’s Hot (or Not)?
As ESG becomes a more integral part of executive compensation, particularly diversity and inclusion metrics, companies are looking for benchmarks that will help them set clear, measurable goals. For example, a recent Equilar study found that 44 companies in the Fortune 100 are now including ESG metrics in their executive incentive plans, and diversity was by far the most common.
Compensation teams and boards that are considering these types of incentives may want to ensure that there is either a precedent or a compass for the metrics that they are setting. While each company is unique, compensation committees have to be mindful of the fact that they are accountable to investors, who will want to see information they can easily understand and compare with other companies in their portfolio. The Metric Research function in IPAC now allows for that.
“As we all know, diversity and inclusion is one of the most important topics being talked about in the comp committee now,” said Carlin. “They’re saying today, ‘everyone is doing this, everyone is putting these metrics in, just look at the headlines.’ Well, now you can actually find out, particularly as this next proxy season rolls out, whether that is really true for your peer group and how heavily they are weighting it.”
Discover how IPAC can help construct incentive plans that align executive interests with those of shareholders.

Senior Editor at Equilar
Dan Marcec, Senior Editor at Equilar, authored this post. Please contact Amit Batish, Director, Content & Communications, at abatish@equilar.com for more information on Equilar research and data analysis.


