Equilar 100: The Highest-Paid CEOs at the Largest U.S. Companies
Pay Trends During the Pandemic Show More Than Meets the Eye
April 20, 2021
Dan Marcec
Each year, the Equilar 100 provides an early look at executive pay trends by examining CEO compensation at the largest companies by revenue. As featured in CNBC, the study includes companies that filed proxy statements before March 31, considered the “half-way” point in the annual proxy season. Thousands more public companies will file executive compensation data during the months of April and May.
The COVID-19 pandemic caused upheaval throughout the U.S. economy in 2020, and executive pay does not appear to have felt intense effects at a surface level. Median total direct compensation for Equilar 100 CEOs in 2020 was $15.5 million, 1.6% lower than the median $15.7 million awarded to CEOs on the 2019 list*. Meanwhile, median revenue for the largest 100 companies to file by March 31, 2021 was $37.4 billion, up slightly from $37.3 billion the year prior.
These broad numbers tell an important story — that the U.S. economy was resilient in a historically turbulent time — but they also mask the true impacts of 2020 and warn against overvaluing trend data. There was notable volatility at a company-by-company level, in harmony with the realities felt in the market.
For example, 32 CEOs in the Equilar 100 saw a smaller pay package in 2020 than in 2019, compared to just 23 who saw a dip the year earlier. In addition, revenues declined 3% at the median for Equilar 100 companies in 2020, vs. a 3% gain at the median in 2019. Notably, 56 companies saw revenue declines in 2020, and 27 of those were double-digit losses. In 2019, 23 companies saw revenue drop, and just five saw losses greater than 10%. These are just two scenarios that show a much richer story behind the numbers.
The introductory page of this feature highlights the top 10 highest-paid CEOs at Equilar 100 companies. Below the highest-paid CEO table, there is a link to the full Equilar 100 in an interactive chart that allows you to sort by compensation, change in pay, pay ratio and revenue. A summary of key highlights from the report follows below the chart on this page.
|
EXECUTIVE NAME
COMPANY (TICKER) |
TOTAL COMP. |
CHANGE IN PAY** |
FY END REVENUE ($M) |
| 1.
|

|
Larry Culp
General Electric (GE)
|
|
$ 72,728,233 |
208% |
$ 79,619 |
| 2.
|

|
John J. Donahoe II
Nike (NKE)
|
|
$ 53,499,980 |
n/a |
$ 37,403 |
| 3.
|

|
Satya Nadella
Microsoft (MSFT)
|
|
$ 44,321,788 |
3% |
$ 143,015 |
| 4.
|

|
Thomas M. Rutledge
Charter Communications (CHTR)
|
|
$ 38,670,620 |
353% |
$ 48,097 |
| 5.
|

|
Alfred F. Kelly Jr.
Visa (V)
|
|
$ 26,364,928 |
9% |
$ 21,846 |
| 6.
|

|
Steven Mollenkopf
Qualcomm (QCOM)
|
|
$ 25,930,689 |
12% |
$ 23,531 |
| 7.
|

|
Kevin P. Hourican
Sysco (SYY)
|
|
$ 25,872,425 |
n/a |
$ 52,893 |
| 8.
|

|
Brian T. Moynihan
Bank of America (BAC)
|
|
$ 25,266,597 |
-1% |
$ 74,208 |
| 9.
|
|
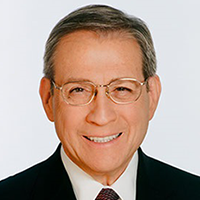
Michael F. Neidorff
Centene (CNC)
|
|
$ 24,956,777 |
-6% |
$ 111,115 |
| 10.
|

|
Stephen J. Squeri
American Express (AXP)
|
|
$ 24,156,744 |
2% |
$ 31,357 |
Key Trends and Takeaways
-
CEO pay is down overall, if only ever-so-slightly. Median total compensation was $15.5 million for Equilar 100 CEOs in 2020, which represents a difference of 1.6% from the median $15.7 million awarded to the CEOs who appeared on the 2019 list.
-
Changes in pay were focused on the near term. Median salary saw about a $50,000 decline when comparing the 2020 Equilar 100 to the 2019 list ($1,325,000 in 2020 vs. $1,373,561 in 2019). Meanwhile, the difference between the median annual cash bonus among CEOs from year to year was nearly $600,000 ($3.0 million in 2020 vs. $3.6 million in 2019).
Equity awards, typically structured to pay out based on performance tied to long-term goals, had higher median values in 2020 than in 2019, and as a general trend were much less likely to undergo notable changes. For example, of the approximately 500 companies that disclosed changes to their pay in the first 6 months of 2020, 449 altered salary vs. just 92 for bonus plans and 33 for long-term incentive plans.
-
The CEO-to-median-employee pay ratio appears to be shrinking. Among Equilar 100 companies in 2020, the median CEO Pay Ratio was 238:1, which was lower than 252:1 seen on the 2019 list.
This is in contrast to a recent study looking at a wider set of early-filing companies, which showed a slight dip in CEO pay as well, but a widening gap among CEOs and their median employees’ compensation. While the comparison of CEO compensation to employee pay is fraught with inconsistencies and is challenging to reconcile from company to company, this figure continues to be a lightning rod for discussions around executive pay, propelling further examination of how companies manage their human capital resources.
-
Fewer women lead the largest companies. There were just six women in the CEO position at Equilar 100 companies in 2020, in comparison to nine the previous two years. None of these women were among the top 10 highest paid.
Phebe Novakovic, CEO of General Dynamics, was the 34th highest-paid CEO in the Equilar 100 in 2020. It is worth noting that Safra Catz, CEO of Oracle, had been perennially among the highest-paid CEOs prior to a $108 million compensation package awarded in 2018 intended to stretch over a multi-year period. Catz was the second-lowest paid CEO on the 2020 list as her compensation package only included salary and the value of any other perks she received.
-
The best of the best get better. Apple topped the list again this year, with revenues of $274.5 billion in 2020, up from $260.2 billion in fiscal year 2019. Berkshire Hathaway, its annual rival for the title of largest company in the Equilar 100 study, had the second largest revenue base, totaling $245.5 billion, a drop from $256.1 billion in 2019.
After several consecutive years as the third largest company in the Equilar 100, AT&T ($171.8 billion) fell to number five, behind AmerisourceBergen ($189.9 billion) and ExxonMobil ($181.5 billion). The threshold for this year’s list belonged to power management company Eaton Corporation, with $17.9 billion in 2020 revenues. The threshold for the 2019 Equilar 100 list was $17.2 billion.
-
Overall revenue figures mask market volatility. Median revenues for the 2020 Equilar 100 overall were $37.4 billion, up slightly from $37.3 billion for the largest companies on the 2019 list. However, on a company-by-company basis, the median company saw revenues decline approximately 3% in 2020. On average, revenues were flat, whereas revenues increased by 3% at the median in fiscal year 2019 for Equilar 100 companies, increasing an average of 7%.
*Note: While many of the companies in the Equilar 100 are consistent from year to year, due to changes in revenue and floating filing dates, the list is not the same every year.
**n/a = CEO did not serve two full fiscal years
Equilar Executive Compensation Solutions
Equilar offers a wide range of tools and solutions that allow companies to optimize their executive benchmarking process. Tailor your benchmarking analysis to compare pay for specific executives within your organization against those of your peer group. Visit www.equilar.com/executive-compensation to learn more.
Contact

Dan Marcec
Senior Editor at Equilar
Dan Marcec, Senior Editor at Equilar, authored this report. Charlie Pontrelli, Senior Project Manager, contributed the data and analysis for this study. For more information on Equilar research and data analysis, please contact Amit Batish, Director of Content and Communications, at abatish@equilar.com.
 Solutions


