Products
Resources
Company

The peer group selection process is a critical component of executive compensation benchmarking at public companies. Peer groups provide valuable insight for shareholders on how companies structure and frame their compensation decisions. Of course, the introduction of new SEC Pay Versus Performance (PvP) requirements put forth an added layer of complexity in the compensation puzzle. As part of the new requirements, companies are required to disclose their own TSR and peer group TSR in a table, along with a narrative of the relationship between the two.
In addition to purposes for the PvP rules, shareholders will closely examine peer group malpractice that occurs when a company selects a larger company or “aspirational” peers to justify higher compensation packages to their executives. Therefore, it is essential that companies approach the peer selection process astutely. In this study, Equilar examines the composition of peer groups across the Equilar 500—the 500 largest U.S. companies by revenue—to provide knowledge into how companies select peers for executive compensation benchmarking purposes.
As part of SEC rules, public companies are required to disclose their peers and the criteria behind the selection of their peers. In relation to how companies select their peers, the study shows that five was the most common number of peer group criteria disclosed across the Equilar 500, with 24% of companies disclosing five criteria in 2022. Overall, 71.8% of companies disclosed three to six different peer group criteria, while just 3.6% of companies disclosed more than seven.
Figure 1: Count of Disclosed Peer Group Criteria (Equilar 500)

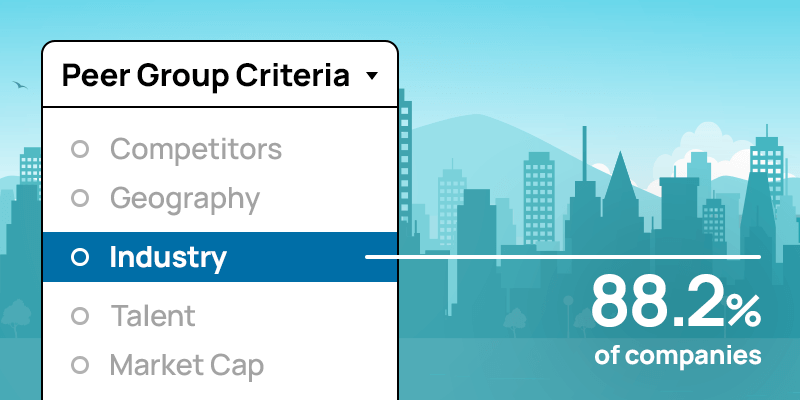
The top four peer group criteria from the study were industry, revenue, talent and market cap, each used by at least 60% of Equilar 500 companies. Perhaps to no surprise, industry led the way, with 88.2% of companies using the criterion in their peer group selection process. One of the goals of a company when constructing a peer group is to reflect its current business and operations, and the use of industry as a peer criterion accomplishes this. One industry may be impacted differently than another during economic swings, and by leveraging industry as a peer criterion, it allows stakeholders to accurately compare compensation in relation to performance despite volatility in the market.
Figure 2: Peer Group Criteria (Equilar 500)

Diving deeper into the data shows that industry was the most used peer group criteria at nine of the 11 industries examined in this study. Revenue also remains a popular criterion—a strong indicator to compare financial health across organizations—with 76.6% of companies using the metric. Revenue was also among the most prevalent metrics found in the top two criteria of sectors, trailing only industry.
Figure 3: Most Used Peer Group Criteria by Sector (Equilar 500)
| Rank | Basic Materials | Communication Services | Consumer Cyclical | Consumer Defensive | Energy | Financial Services | Healthcare | Industrials | Real Estate | Technology | Utlilities |
|---|---|---|---|---|---|---|---|---|---|---|---|
| 1 | Industry | Industry | Industry | Industry | Industry | Industry | Revenue | Revenue | Industry | Industry | Industry |
| 2 | Revenue | Talent | Revenue | Revenue | Market Cap | Talent | Industry | Industry | Revenue | Revenue | Revenue |
| 3 | Market Cap | Revenue | Talent | Talent | Talent | Revenue | Market Cap | Talent | Market Cap | Market Cap | Talent |
| 4 | Talent | Market Cap | Market Cap | Market Cap | Assets | Competitors | Talent | Market Cap | Talent | Talent | Market Cap |
With respect to peer group size, ideally, a peer group features enough companies to provide reliable data and insight while also not being so large that it complicates the benchmarking process. According to the study, the most common size observed across the Equilar 500 was 16 to 20 companies, with 40.6% of companies falling in this range. The next most common range was 11 to 15 companies at 28.8% prevalence. While uncommon, 14.8% of companies disclosed a peer group featuring more than 20 companies. On the other hand, just 8.6% of companies had a peer group size of one to 10 companies—a foreseen finding as market data from smaller peer groups are more likely to be volatile.
Figure 4: Peer Group Size (Equilar 500)

Scrutiny around executive compensation appears to intensify with each passing year, and the introduction of PvP rules will only escalate any backlash from poor benchmarking practices. Therefore, it is critical that companies remain mindful when determining their peers and select those that best reflect their own business. The goal of executive compensation is to motivate executives to drive performance, and the selection of a peer group is a crucial step to ensure exceptional practices.
The Equilar Peer Group Dashboard is a data-driven approach to evaluating your current peer group. Determine whether modifications to your peer group are necessary, and compile a set of potential peers that fit your desired criteria. Watch the Peer Group Dashboard in action. Contact us at info@equilar.com to learn more.

Director of Content & Communications at Equilar
Amit Batish, Director of Content & Communications at Equilar, authored this post. Please contact Amit Batish at abatish@equilar.com for more information on Equilar research and data analysis.


