Products
Resources
Company

Without a doubt, the 2023 proxy season will be headlined by the implementation of new SEC Pay Versus Performance (PvP) rules. The PvP rules require companies to disclose information reflecting the relationship between compensation actually paid (CAP) to a company’s named executive officers (NEOs) and the company’s financial performance. Indeed, the first-year disclosures will introduce an added layer of complexity as boards and compensation committees design executive pay packages for future years. As this proxy season will serve as the inaugural year for the PvP disclosures, companies face tremendous pressure to put their best foot forward to adequately tell their pay versus performance story.
To provide context into how the rules are shaping, Equilar is closely tracking PvP proxy disclosures. This segment features examples of tabular and narrative PvP disclosures captured in proxy filings and will be updated through the duration of proxy season. Equilar has also launched a PvP Tracker to track the various calculations and performance measures within PvP proxy disclosures. View the PvP Tracker for the latest updates.
Equity Methods, the industry leader in equity compensation valuation and accounting, will be providing commentary and expert insights to contextualize these disclosures and highlight any noteworthy features.
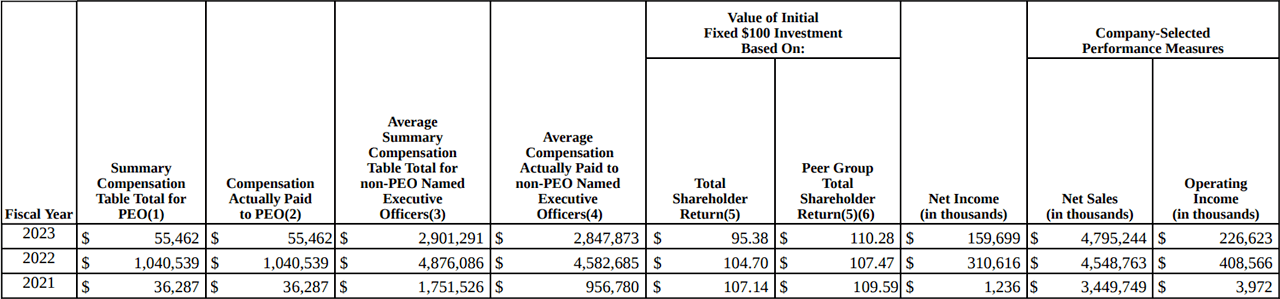
Roper Technologies (ROP)
DEF14A filed 4/28/2023
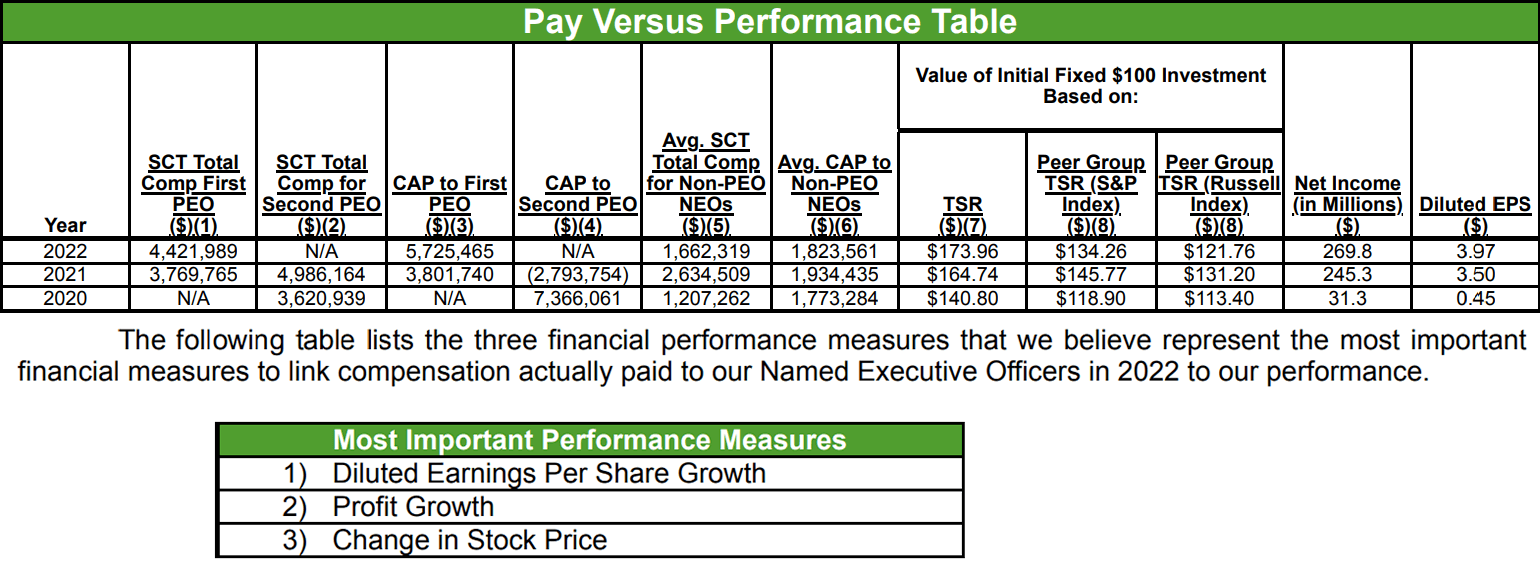
IMPINJ INC. (PI)
DEF14A filed 4/26/2023
Takis Makridis, President & CEO
David Outlaw, Managing Director, Valuation & HR Advisory Services

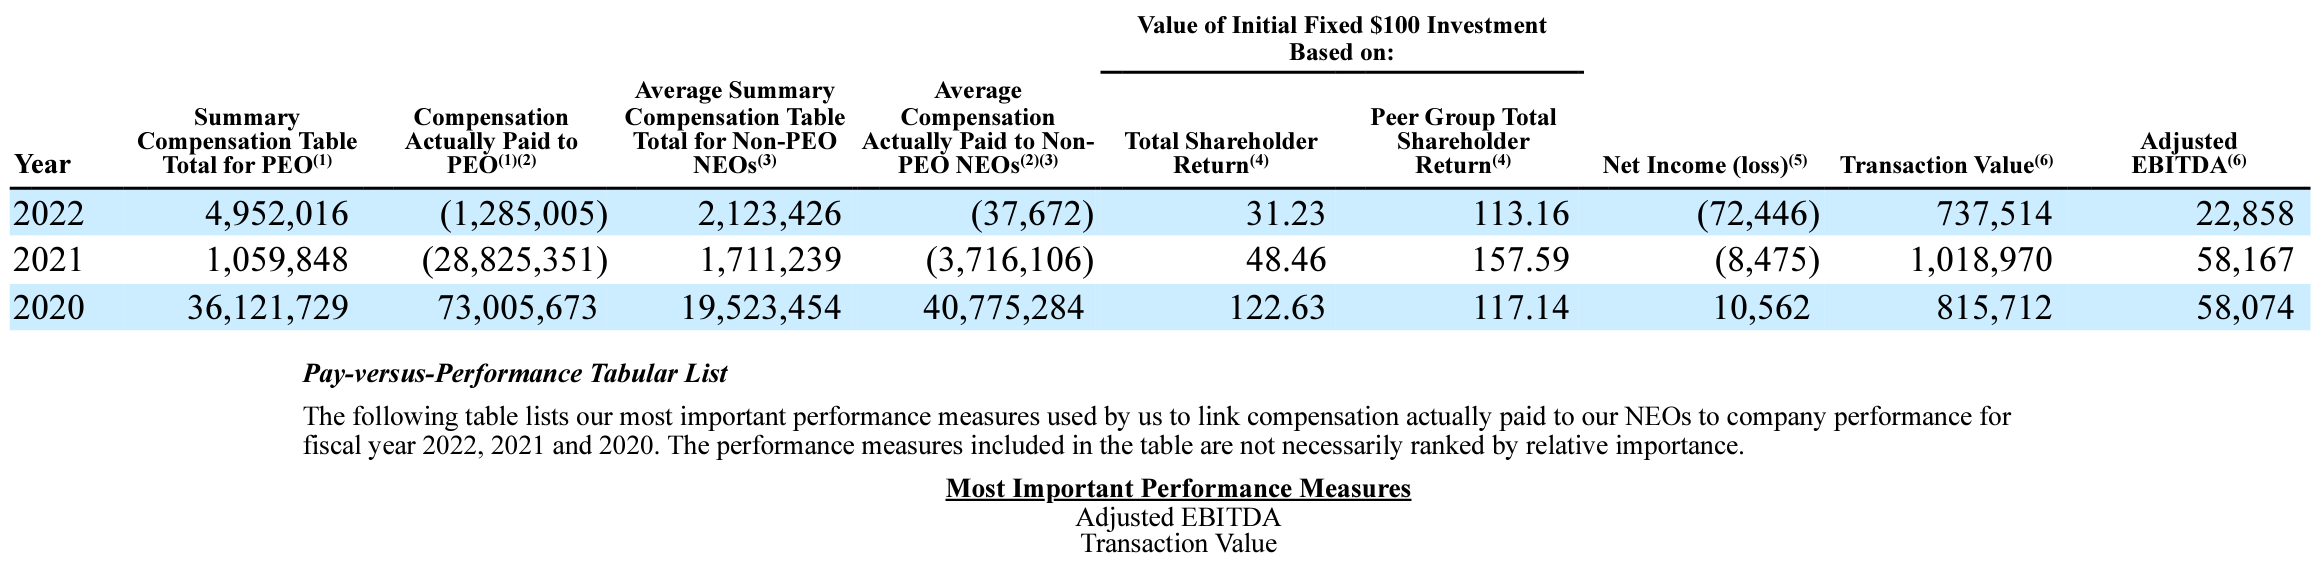
IMPINJ is another case of a company electing to use two CSMs in their PvP table, revenue and adjusted EBITDA. Since their PSUs are based only on multi-year TSR, and multi-year metrics are not allowed as a CSM based on the Question 128D.11 of the February C&DI release, the company is using the two metrics from its bonus plan. Again here, the use of two CSMs in these cases is allowed but not required.
Notably, IMPINJ discloses the actual range of valuation assumptions (volatility, expected life, dividend yield and risk-free rate) used in its option valuations for each year. This valuation assumption disclosure closely mirrors what all companies disclose in their 10-K for new grant valuations. The text of the rule is unclear on how much detail is required for this aspect of the disclosure, and while IMPINJ errs on the side of providing more disclosure than the average, their level of disclosure is cleanly in line with the rule’s requirements.
Zumiez, Inc. (ZUMZ)
DEF14A filed 4/21/2023
Takis Makridis, President & CEO
David Outlaw, Managing Director, Valuation & HR Advisory Services
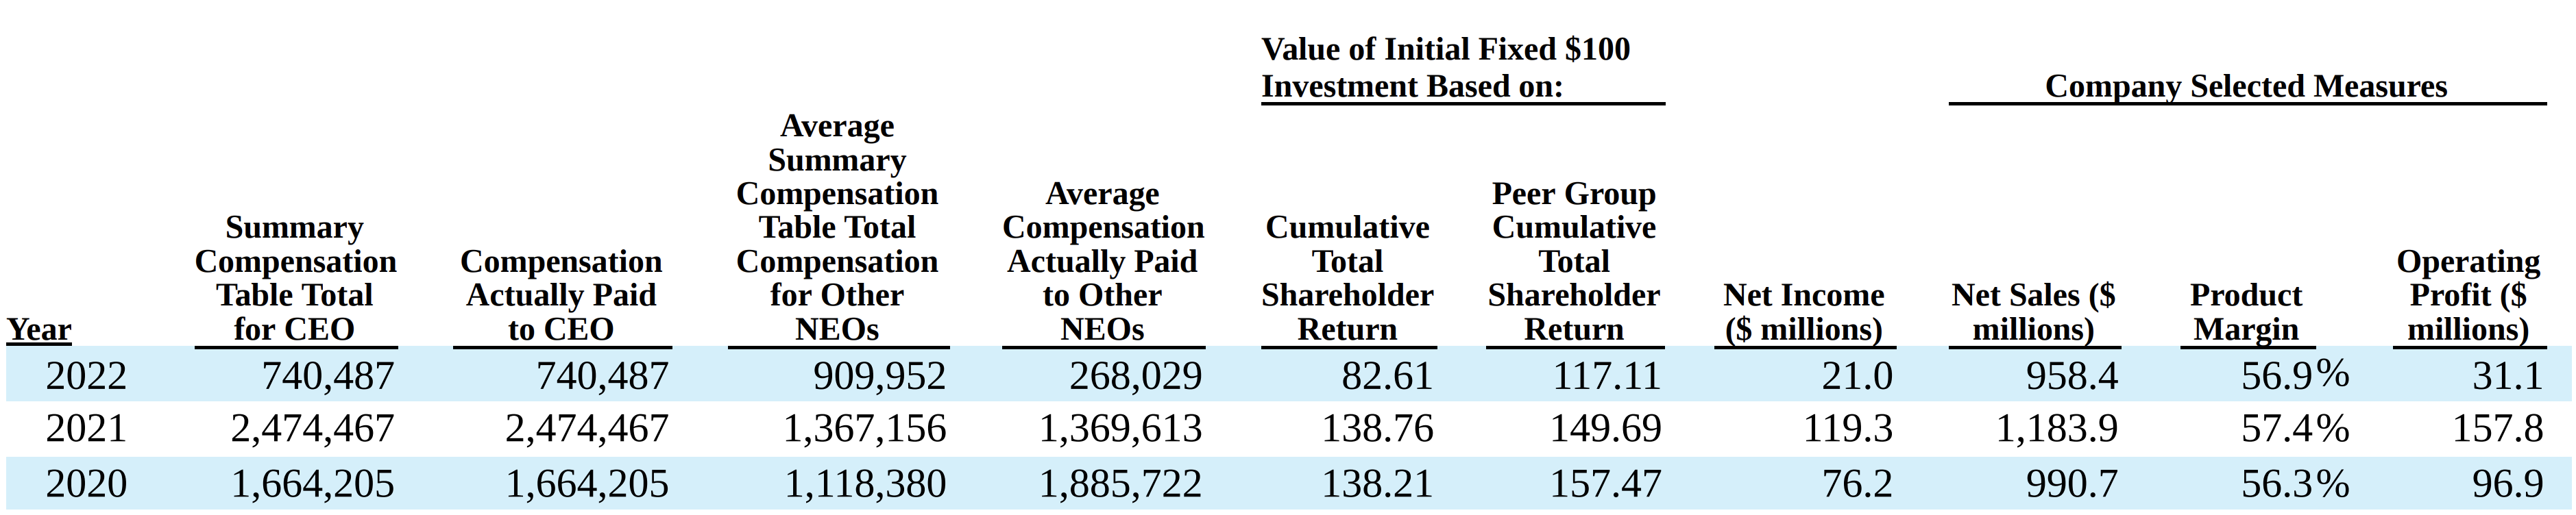
Zumiez is a disclosure that goes above and beyond in some ways but is very brief in others. Notably, the company discloses three CSMs: net sales, product margin and operating profit. As discussed in other cases in this tracker, the use of multiple CSMs is generally allowed but not required. In this case, the CSMs selected by Zumiez are the primary metrics in their bonus plan, as their long-term incentive plan only uses time-based awards. Interestingly, Zumiez elected to use all three metrics as CSMs even though operating profit is weighted more heavily than the other metrics in their bonus plan. An alternative approach would have been to select operating profit as the CSM and include the other metrics in the tabular list.
Although three metrics are listed as CSMs, the tabular list is not otherwise present in the disclosure. Also, the deduction-and-addition breakdown footnote to bridge SCT pay and CAP is not present for the PEO, only for the other NEOs. Finally, the disclosure omits the relationship disclosures of Item 402(v)(5). Each CSM, net income and TSR need their own specific relationship disclosures.
As we discuss the year-two priorities with clients based on questions from their boards, a big theme is going to be analytics that explain more clearly and in plain-language what is changing (and why) in the key metrics. However, a second and important evolution will be convergence in disclosure quality. We have been very focused on refining our templates, processes and checklists given the frequency of omitted items observed across disclosures in the market this year.
Interdigital (IDCC)
DEF14A filed 4/20/2023
Takis Makridis, President & CEO
David Outlaw, Managing Director, Valuation & HR Advisory Services
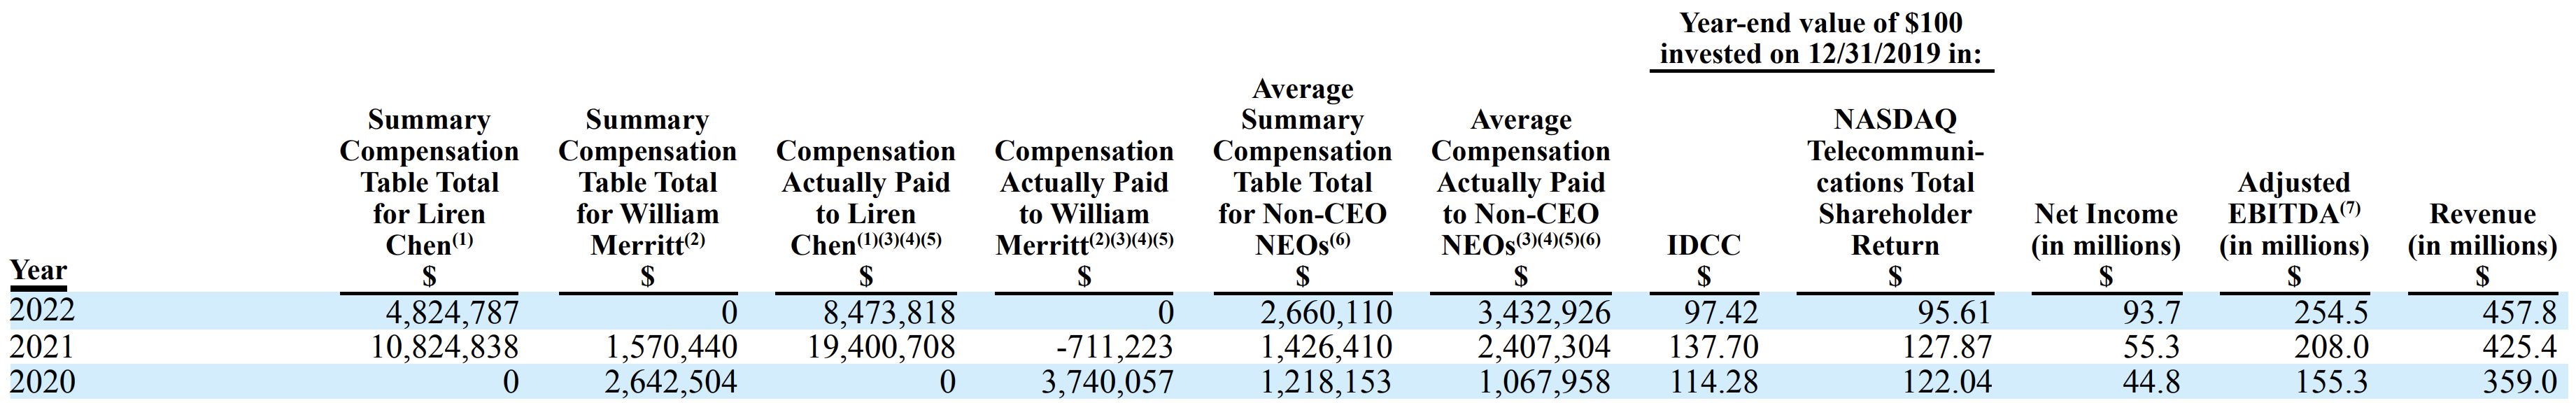
You’ll be forgiven for having to squint at the smaller text of InterDigital’s disclosure table, as it has more detail packed in than most companies do. First, InterDigital had a PEO transition in 2021, meaning each PEO’s information is broken out separately. Second, InterDigital elected to use two CSMs: adjusted EBITDA, which is used in their LTIP, and revenue, which is used in their STIP. As is appropriate, their relationship charts include both of the CSMs alongside net income and TSR.
In their footnotes, InterDigital took an interesting middle-ground approach to the valuation assumption disclosure. They did not provide a 10-K style breakdown of all of the assumption numbers, nor did they stick to a brief disclaimer that the assumptions were similar to those used at grant. Instead, they concisely bulleted out how assumptions were computed so that investors can understand what steps were taken to compute the input assumptions.
Amazon.com, Inc. (AMZN)
DEF14A filed 4/13/2023
Takis Makridis, President & CEO
David Outlaw, Managing Director, Valuation & HR Advisory Services
First off, with 18 shareholder proposals, it took a few minutes to simply find Amazon’s PvP disclosure. It’s a good thing we’ve shifted away from paper-based proxies.
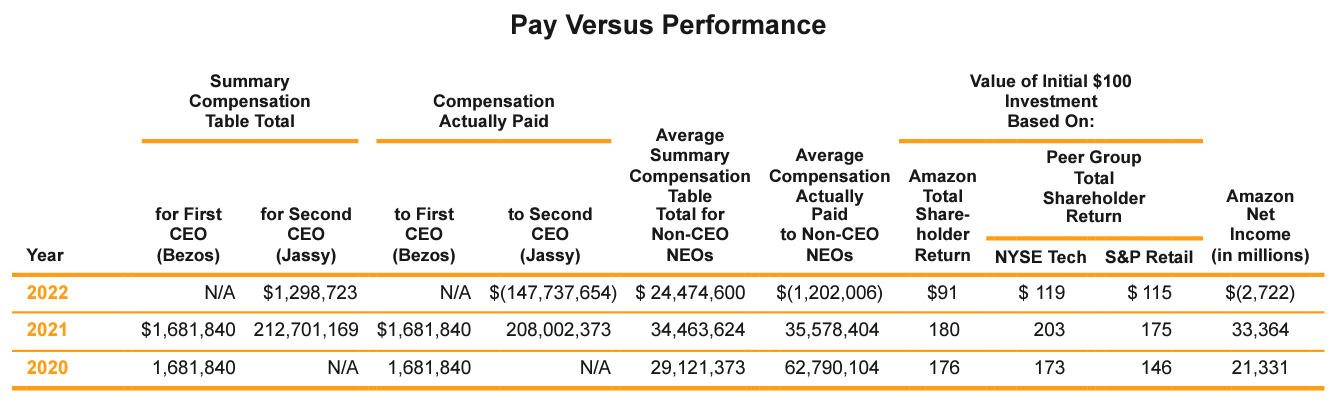
Amazon’s PvP table captures Andrew Jassy taking over the CEO role from Jeff Bezos in 2021. As is customary in such high-profile CEO transition cases, Andrew was awarded a one-time mega grant. For fiscal year 2021, Andrew’s summary compensation table (SCT) pay was $212M and compensation actually paid (CAP) was $208M. Amazon’s share price declined significantly in 2022, yielding a -$147M CAP in 2022.
We’re often asked how CAP can be negative. As a reminder, CAP is calculated based on all outstanding and unvested awards. For awards granted in a prior period, a mark-to-market valuation is done to measure the value as of the end of the current fiscal year in relation to the value as of the end of the prior fiscal year. In the same way as a financial derivative can trigger a negative charge to earnings if its value falls in a period, so too will outstanding incentive awards whose value declines in a year.
Finally, Amazon’s disclosure is a good example of a non-smaller reporting company (SRC) that does not have a company-selected measure (CSM). Remember, the CSM is the most important financial metric that explains changes in CAP. A CSM is required except if there is not a metric that meets the criteria. Amazon does a nice job of explaining why when they write, “the Company does not use any financial measures to link executive compensation to company performance since our executives’ compensation is tied directly to the creation of shareholder value, as reflected by changes in our total shareholder return.”
Overall, we like Amazon’s disclosure. Many companies may find it too wordy for their liking, but there are good kernels of content throughout that are worth reviewing.
TTEC Holdings, Inc. (TTEC)
DEF14A filed 4/11/2023
Takis Makridis, President & CEO
David Outlaw, Managing Director, Valuation & HR Advisory Services
This disclosure has some odd components but also some useful lessons. First, the company provides a preamble to the core PvP table in which they reiterate their pay for performance philosophy. Our advice is to generally resist the urge to rehash too much of the CD&A content within the PvP disclosure and to begin the PvP disclosure with a reminder that it is constructed pursuant to Item 402(v).
TTEC provides extensive footnote commentary on how they are excluding certain equity awards from the determination of compensation actually paid (CAP) because those grants have deferred performance measurement periods. Setting aside the technical accounting issues behind this topic, what we like is that TTEC follows an important disclosure principle: when there’s room for ambiguity or dissension, disclose it.
Finally, the disclosure omits the relationship disclosures of Item 402(v)(5). A company TSR to peer TSR is provided in narrative form, but there is no graphical and/or narrative disclosure on the relationship between CAP and TSR, net income, and the three company-selected measures (CSMs). Each CSM needs its own specific relationship disclosure.
Equitable Holdings, Inc. (EQH)
DEF14A filed 4/11/2023
Takis Makridis, President & CEO
David Outlaw, Managing Director, Valuation & HR Advisory Services
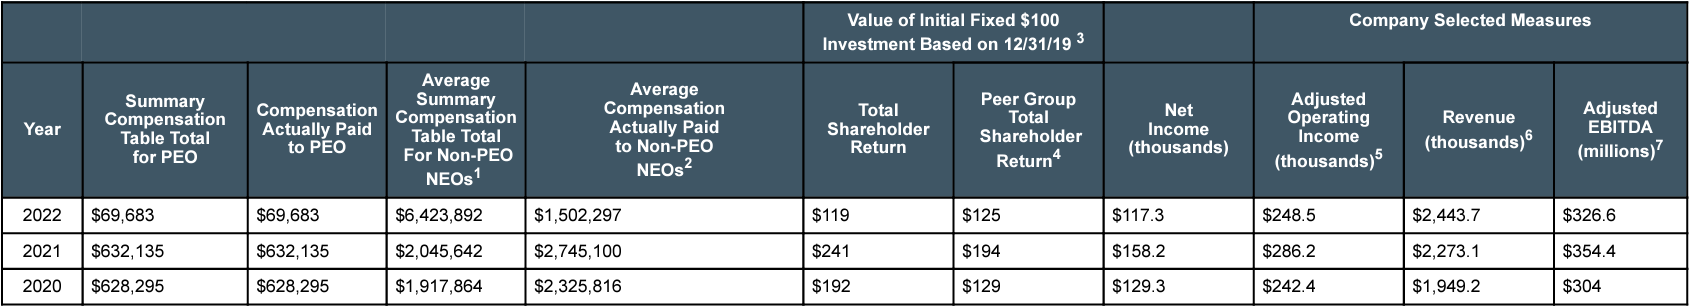
This is an interesting disclosure with some useful takeaways. First, the company introduces a supplemental disclosure, which in our research is rare. Specifically, they present Relative 3-year TSR Rank as a second company-selected measure (CSM). Why make it a “supplemental disclosure” and not just a secondary CSM? Because given the SEC’s C&DI’s, the CSM must be a one-year metric. This is arguably the most compliant way to introduce a metric that is deemed genuinely important to determining compensation actually paid (CAP) when that metric is not prima facie eligible as a standard CSM.
The second interesting takeaway is the company’s relationship disclosure, which is a single paragraph of narrative prose. Narrative-only disclosure is rare, but has the benefit of not fixating the reader on a graph that may contain problematic relationships but no context behind those relationships. In our experience, some narrative disclosures offer deep analysis and others are quite shallow. This one strikes a middle ground by certainly not being shallow and dismissive while also not drilling into extreme levels of analysis detail that may be tough to roll forward in future years.
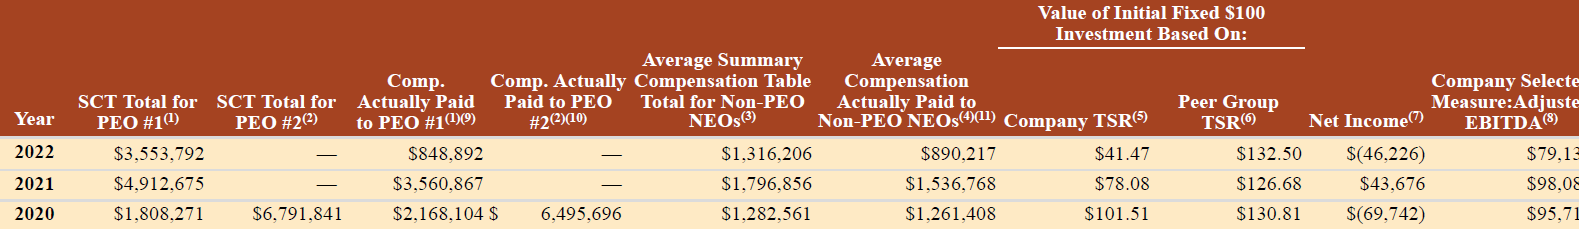
MediaAlpha, Inc. (MAX)
DEF14A filed 4/5/2023
Takis Makridis, President & CEO
David Outlaw, Managing Director, Valuation & HR Advisory Services
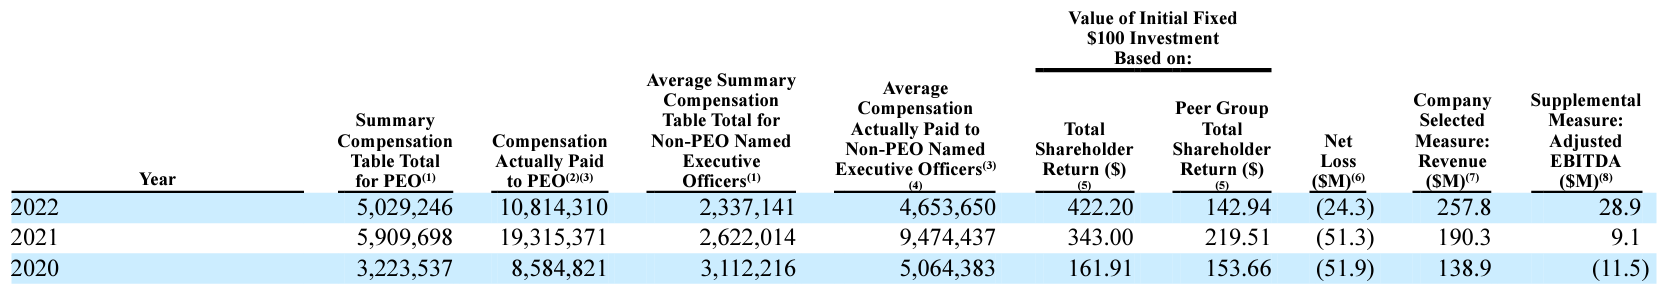
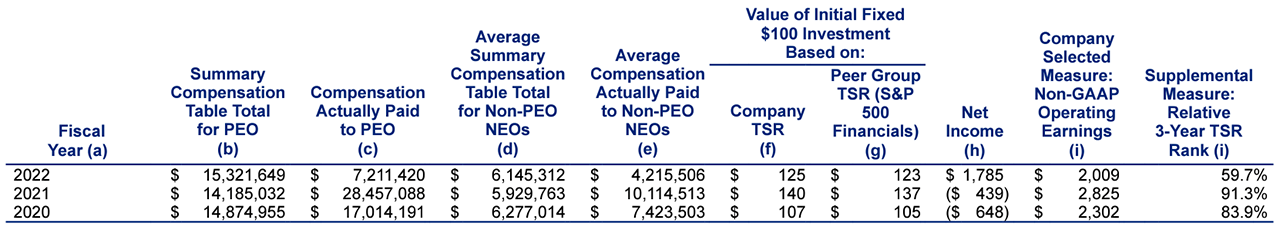
The standout feature of MediaAlpha’s disclosure is the effect of a mega-grant on shaping all of the compensation actually paid (CAP) calculations across the years. Their PEO and some of the NEOs received very large grants in 2020 in conjunction with their IPO, then received little to no equity in 2021.
This manifests with a large swing in summary compensation table pay: $36 million in 2020 and $1 million in 2021 for the CEO. But it manifests with an even larger swing in CAP: $73 million in 2020 and negative $29 million in 2021! This illustrates the common pattern with large, upfront grants of this nature. Large equity holdings become very sensitive to changes in the stock price, and those changes can wash out the effect of any actual in-year compensation decisions.
Going forward, this lopsided effect on the PvP disclosure may be a valid driver of supplementary disclosure and analysis when discrete events run the risk of obfuscating broader and more insightful patterns in value creation/reduction within the incentive programs.
Urban Outfitters, Inc. (URBN)
DEF14A filed 4/3/2023
David Outlaw, Managing Director, Valuation & HR Advisory Services at
Urban Outfitters’ disclosure is an interesting case due to the unusual nature of its PEO compensation package. The company’s PEO was an original founder of the company, and he still owns over 20% of the stock. For this reason, he receives a $1 salary and does not receive any equity grants. As a result, the PEO’s Summary Compensation Table total pay and his Compensation Actually Paid figures are identical in all years. Further, the relationship between his pay (as measured for this rule) and the company performance are essentially uncorrelated. Of course, the PEO’s total wealth is highly sensitive to company performance due to his large ownership stake, but the PvP rule doesn’t have a mechanism to pick that effect up.
Another interesting aspect of Urban Outfitters’ disclosure has to do with their tabular list of performance metrics. This list comprises Net Sales, Operating Income, and Operating Income rate (or margin). The latter two are very closely related, but are valid to include separately. In Question 128D.09 of its C&DIs, the SEC gave an example that the company-selected measure may be a measure that is “derived from, a component of, or similar to” the other disclosed metrics, and this flexibility applies to the tabular list, as well.
Texas Roadhouse (TXRH)
DEF 14A filed 3/31/2023
David Outlaw, Managing Director, Valuation & HR Advisory Services at
Texas Roadhouse’s disclosure is another example of trying to drive clarity in the midst of a complicated situation that does not fit neatly into the PvP framework. The company’s founding PEO passed away in early 2021, and a new PEO was promoted into the role at that time. The company appropriately breaks out the two PEOs in both its table and its footnote details. The relationship charts are a hybrid, rather than a breakout: they display the first PEO’s pay for 2020 and the second PEO’s pay for 2021 and 2022. This is difficult to display and label clearly in the chart, but arguably is the most representative way to show PEO pay across the years.
Interestingly, Texas Roadhouse provided breakout tables that show the intermediary calculations for each non-PEO NEO. This is not required by the PvP rule, but a common criticism of the non-PEO disclosure is that the averaging process is too noisy to be useful. Texas Roadhouse’s approach provides much greater clarity into the component parts of the non-PEO NEO calculation.
Also notable is Texas Roadhouse’s use of two different peer group indices for TSR comparison. The company uses two indexes in its 10-K disclosure for Item 201(e), and therefore uses both in this disclosure as well. While we believe it would also be consistent with the PvP rule to pick one of the indices used under Item 201(e), full consistency in using both indices is a reasonable interpretation, as well.
Paycom Software, Inc. (PAYC)
DEF14A filed 3/28/2023
Takis Makridis, President & CEO of
Paycom’s PvP disclosure is an illustration of just how sensitive the SEC’s mark-to-market framework is underlying compensation actually paid (CAP). Paycom issued a mega grant in 2020. Since that was the first year for that grant, it led to an outsized 2020 CAP of $352M. CAP fell in 2021 to $62M, but only due to there not being a new grant of the same magnitude—the 2020 mega grant actually appreciated in value in 2021. In 2022, CAP fell to -$149M. The share price at the end of 2022 was 25% below the price at the end of 2021, driving this large negative value.
Paycom’s mega grant was awarded on November 23, 2020; half of it has six years to hit the first stock price hurdle and the other half has 10 years to hit a second stock price hurdle. The mega grant is going to keep bouncing around in Paycom’s PvP table for years to come, sometimes showing sharp value upticks and other times showing downticks. There’ll be so many interim period adjustments that by the time it actually vests and pays out it’ll be hard to glean how well this grant linked the CEO’s pay to his performance over the applicable performance period.
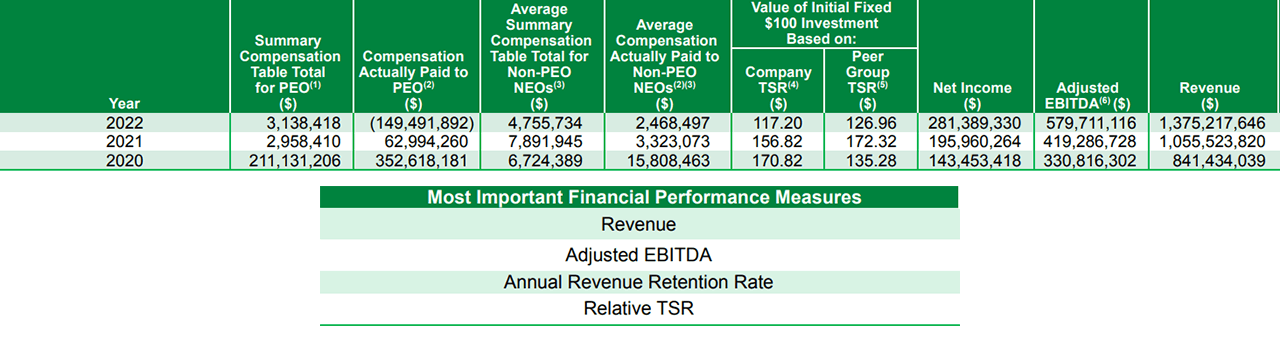
Genpact (G)
DEF14A filed 3/21/2023
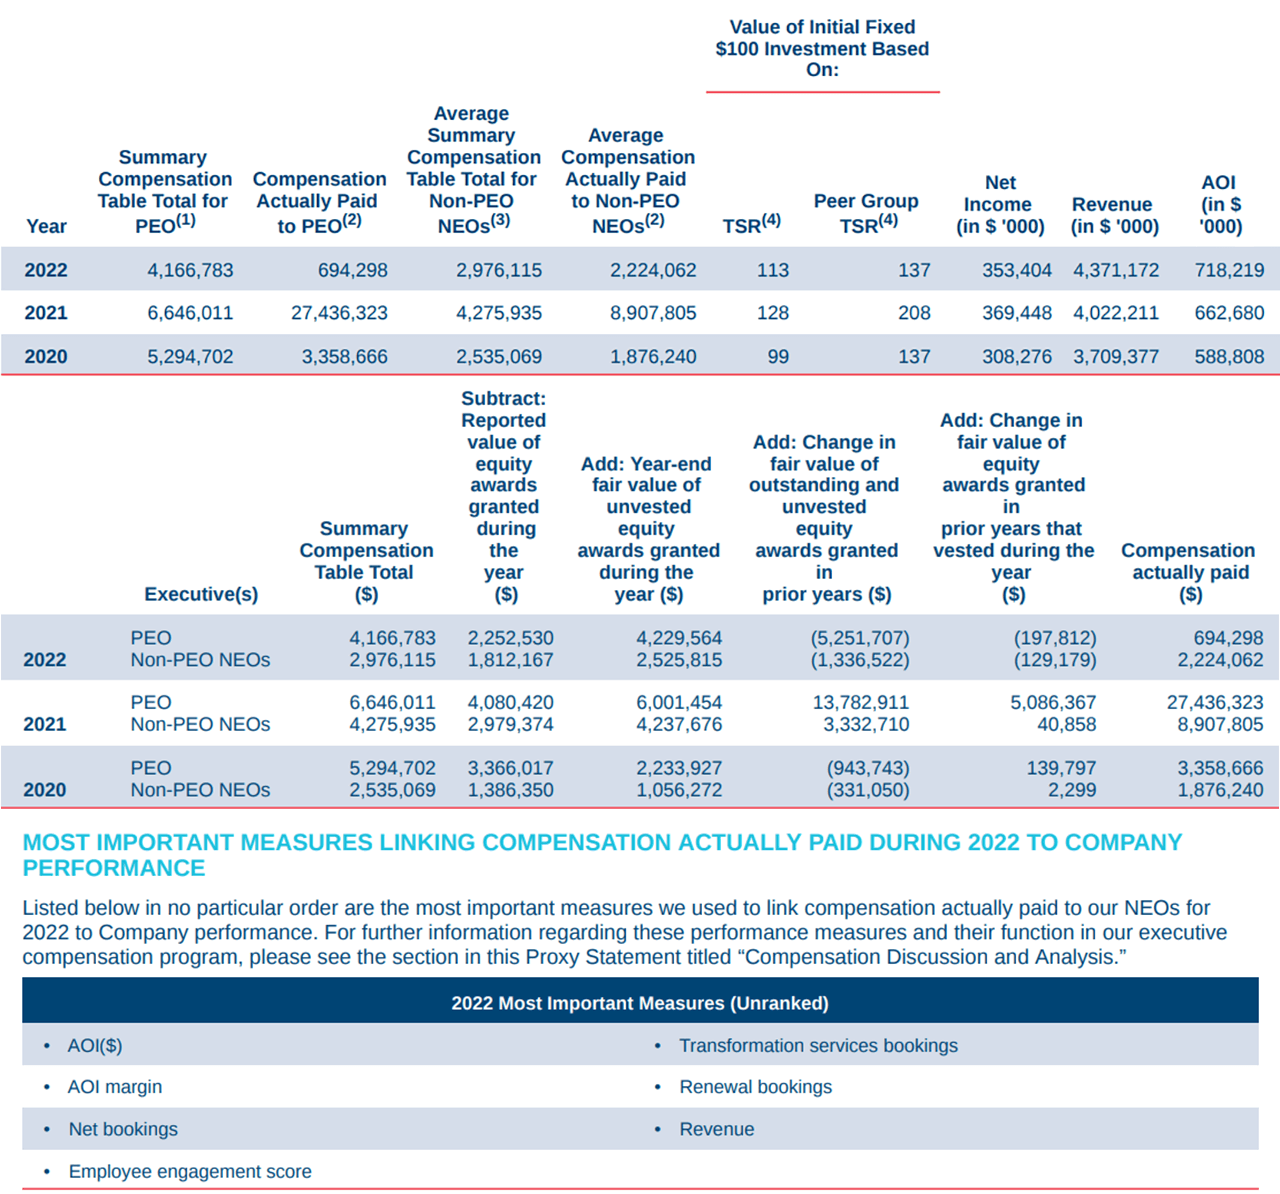
Takis Makridis, President & CEO of
Genpact’s PvP disclosure is well done. Rather than focusing on its component parts, their proxy gives us a case study of a company that has already been providing an alternative pay measure to that in the summary compensation table (SCT). Genpact calls their supplementary pay measure “realizable pay” and locates it immediately below the SCT. (It’s unclear whether their “realizable pay” measure uses the same definition that others may use for “realizable pay,” or if it is more akin to what others would call “realized pay.”)
Genpact’s preexisting realizable pay disclosure results differ massively from their PvP results. They handled this nicely by not giving normative language to the effect of why they think the construct behind their realizable pay disclosure is better, since that could be construed as violating the rules concerning supplemental measures to pay vs. performance. Specifically, the SEC could interpret such normative language as misleading or attempting to make the existing realizable pay disclosure more prominent. Genpact’s matter-of-fact approach avoids that risk.
If you’re wondering just how different the two disclosures are, they’re very different (CEO only):
|
2020 |
2021 |
2022 |
|
|
Realizable Pay |
$4,430,511 |
$7,802,730 |
$6,143,817 |
|
Compensation Actually Paid (per PvP) |
$694,298 |
$27,436,323 |
$3,358,666 |
Which framework is better? That’s a question for another post, but hopefully this gives pause for skepticism when you read news and other articles that draw large conclusions from PvP numbers—remember, this is just one paradigm for thinking about pay. And it’s a paradigm with many moving parts.
ArcBest Corporation (ARCB)
DEF 14A filed 3/17/2023
Takis Makridis, President & CEO of
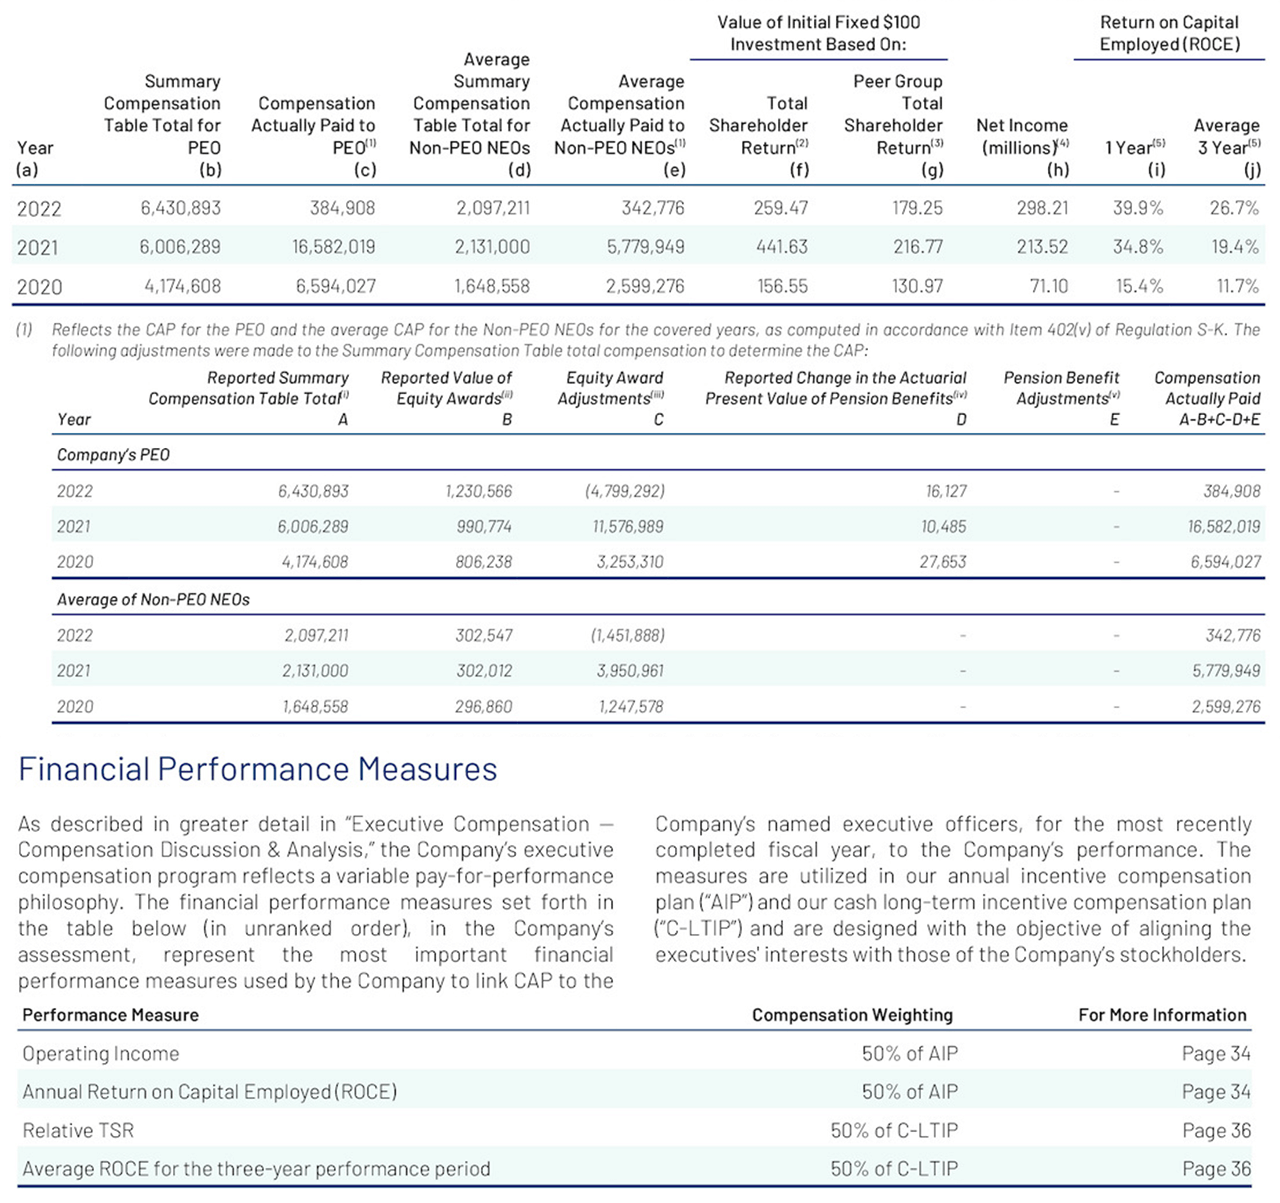
Our first reaction to this disclosure was concern over the inclusion of a three-year ROCE metric in the core table. But ArcBest clearly explains that this is a supplemental metric as opposed to merely a second company-selected measure. As a reminder, any supplemental measure must be clearly labeled as such, not be presented in a more prominent capacity, and not be misleading. ArcBest does a nice job of this.
Another interesting insight from ArcBest’s disclosure is the outsized TSR growth they had in 2021 followed by the outsized decline in 2022. Nonetheless, ArcBest’s cumulative TSR through the end of 2022 was still north of $200 (meaning their overall performance was exemplary).
This is where the pay vs. performance framework really struggles. Compensation actually paid is driven by such a large panel of awards that it’s hard to clearly answer the question shareholders care most about: does pay delivery reflect performance (where pay delivery refers to realized pay)? In ArcBest’s case, the swings in compensation actually paid are primarily driven by outstanding awards, which is to say the final results tell us very little about actual realized pay. This is always a challenge, but becomes especially pronounced with large TSR swings.
W.W. Grainger, Inc. (GWW)
DEF 14A filed 3/16/2023
Takis Makridis, President & CEO of
W.W. Grainger Inc. (Grainger) produced a very strong disclosure. The disclosure is clearly ordered, strikes a healthy balance of delivering clarity without being overly verbose, and is compliant across the key failure points we’ve seen in our research. In particular, Grainger is very methodical in their use of footnotes to make sure the user of the disclosure isn’t left wondering about where a metric or measure came from or where to find its GAAP reconciliation.
Another appealing feature is that Grainger provides a clear depiction of how they subtract the equity award amounts from the summary compensation table totals and then build up to arrive at compensation actually paid.
Grainger took a graph-only approach toward their relationship disclosures. We like this approach because it clearly checks the compliance box based on the language in the SEC rule. Grainger’s specific fact pattern presents an interesting question: given how compensation actually paid is so far above summary compensation table pay, is the excess “reward” justified by the excess performance (as measured by TSR, net income, and Grainger’s two company-selected measures)? This is where we could see proxy advisors trying to build products to quantitative grade and assess the relationships.
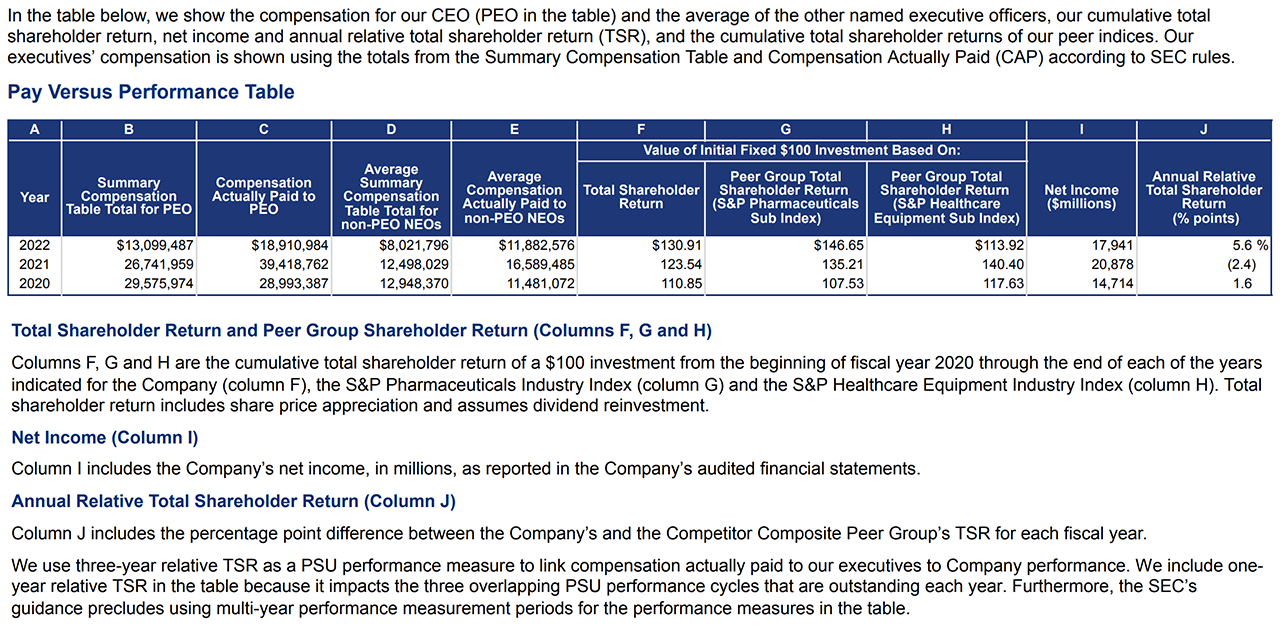
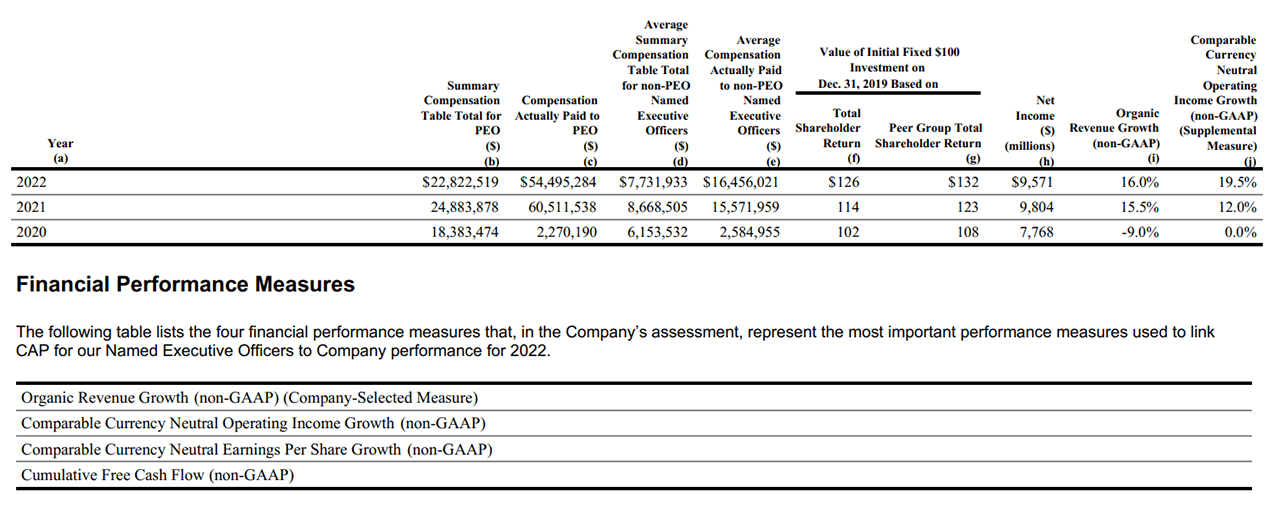
Johnson & Johnson (JNJ)
DEF 14A filed 3/15/2023
Coca-Cola Co (KO)
DEF 14A filed 3/10/2023
Whirlpool Corporation (WHR)
DEF 14A filed 3/8/2023
Takis Makridis, President & CEO of
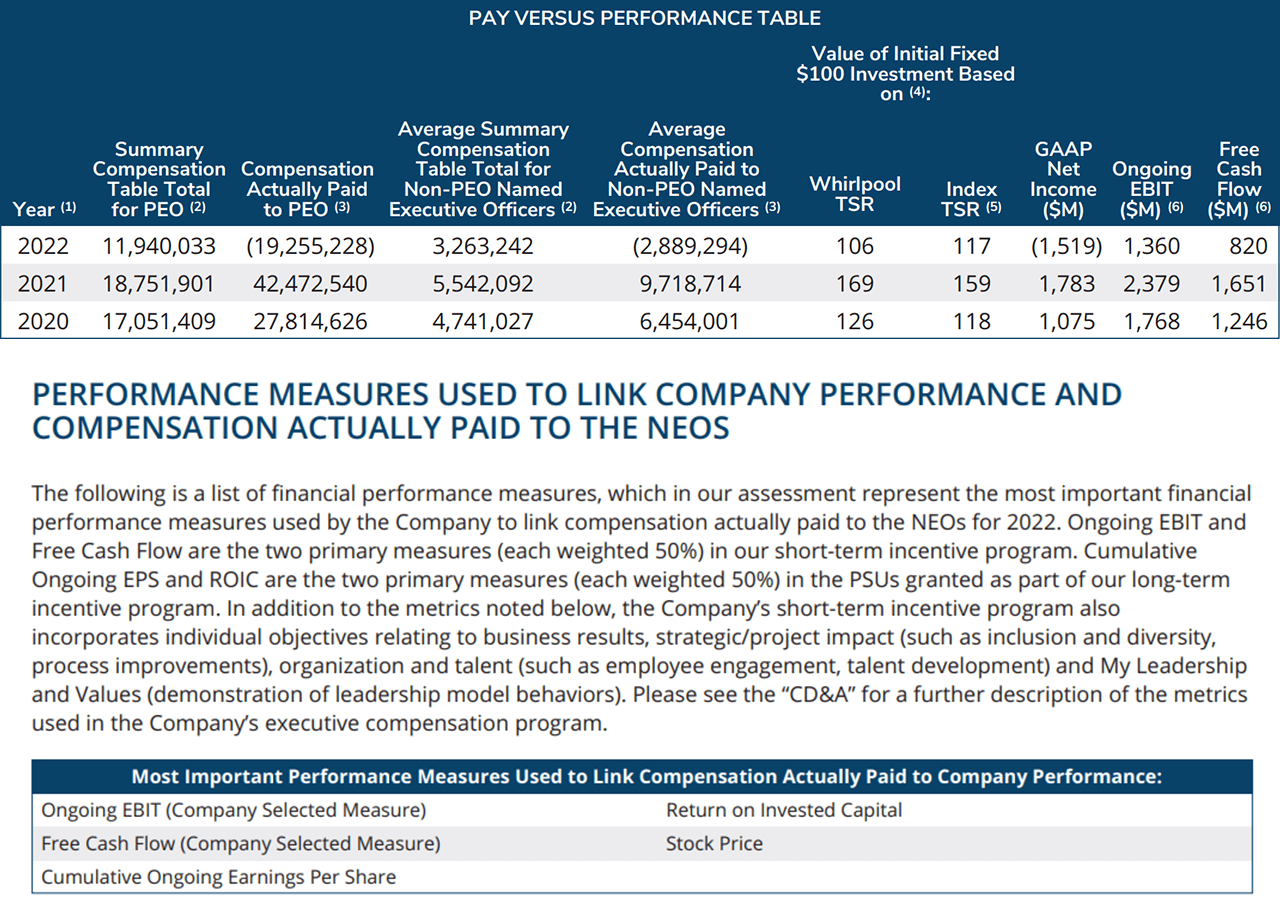
Whirlpool’s disclosure has a few distinguishing elements. First, they are among the few companies that listed two company-selected measures (CSMs), ongoing EBIT and free cash flow. Their explanation is they have two equally weighted annual plan metrics, such that it doesn’t make sense to pick one as being more important than the others. They correctly proceed to provide relationship disclosures for both CSMs as the rules require.
Whirlpool also has two equally weighted long-term incentive plan metrics, cumulative ongoing EPS and return on invested capital (ROIC). Their decision not to choose one or both of these metrics may be tied to the SEC’s C&DI Question 128D.11 concerning three-year metrics. Our view is that it is permissible to transform a three-year metric into its one-year equivalent and use that as the CSM, but we believe using annual plan metrics is also compliant.
Finally, Whirlpool lists stock price in their Tabular List. C&DI Question 128D.10 says stock price cannot be the CSM unless it’s a formal metric, but is silent on whether it can be included in the Tabular List.
Lithia Motors (LAD)
DEF 14A filed 3/8/2023
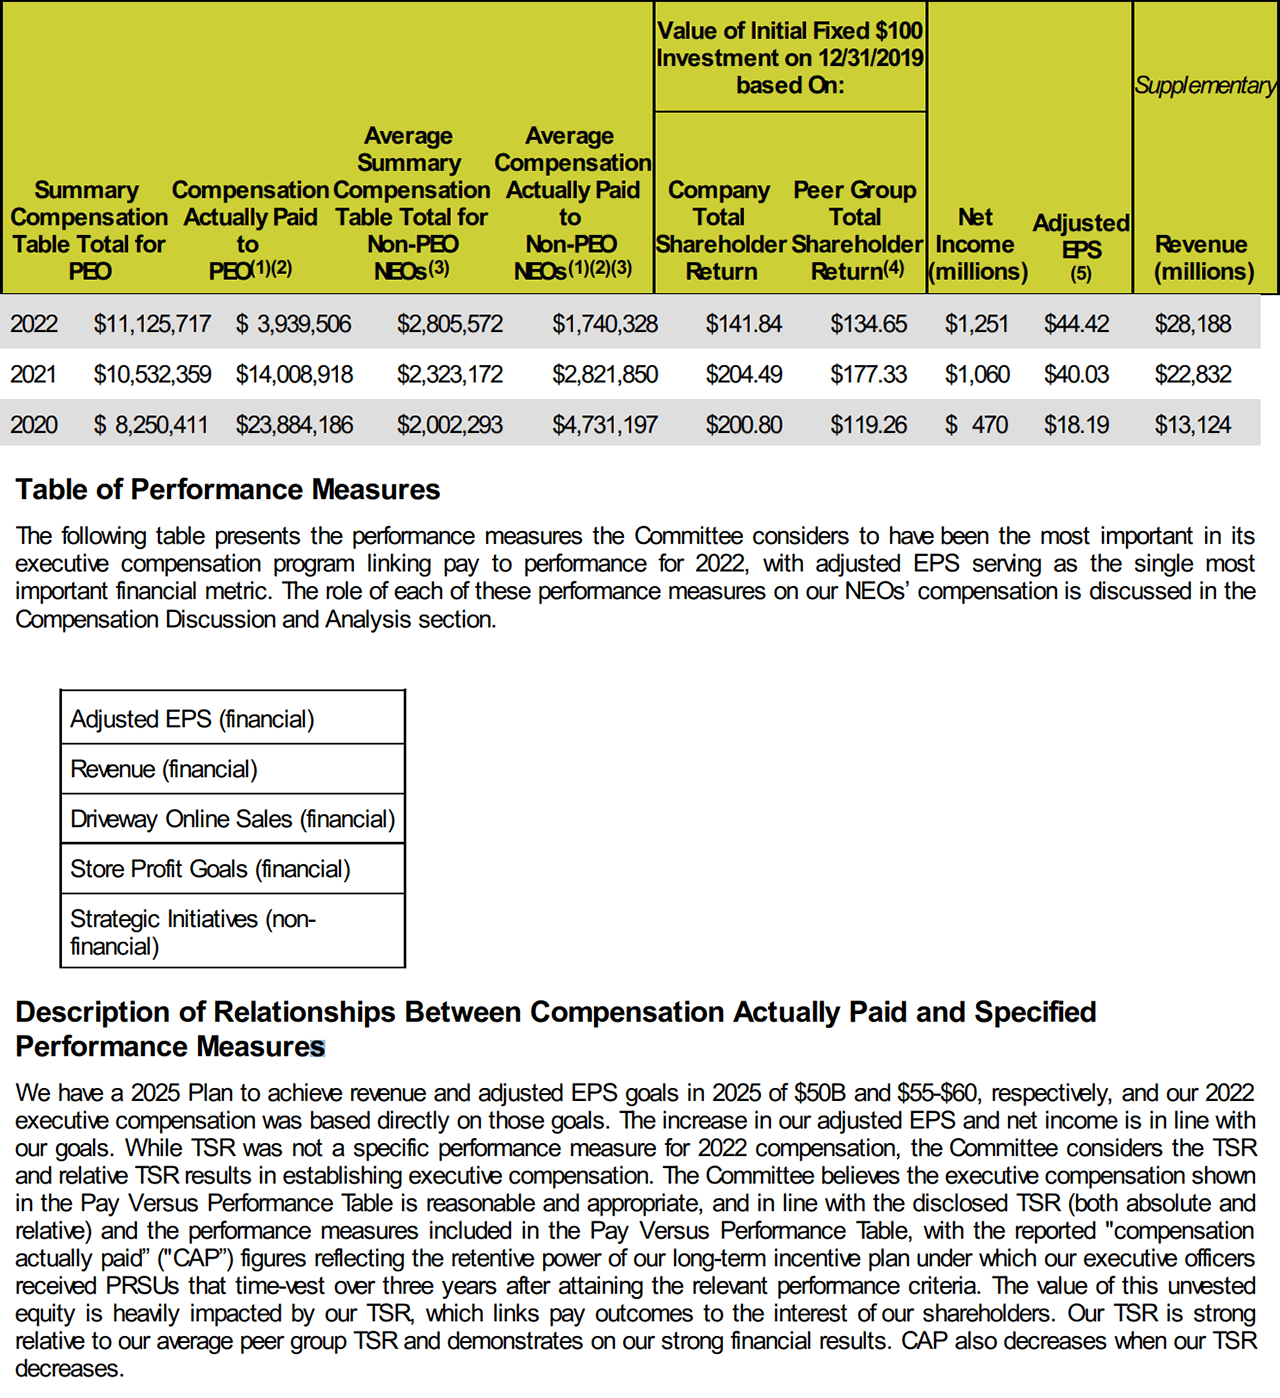
Takis Makridis, President & CEO of
We were surprised by two items in this disclosure. First, it’s missing the breakout of equity adjustments required in Question 128D.04 of the SEC’s C&DIs (and arguably by the core rule in its plain text). The SEC wants companies to separately provide each of the six equity award adjustment components or explicitly state that one or more do not apply.
Lithia’s relationship disclosure reads more like a defense of its compensation setting process than a direct compliance exercise as per the requirements in Item 402(v)(5). While there may be reasons for taking this approach, our general leaning is to simply point back to the CD&A so as not to blur the line between the pay vs. performance disclosure and the compensation committee’s considerations as outlined in the CD&A.
Further, in focusing so much on justifying the alignment of CAP to TSR, Lithia’s commentary is light about the relationship between CAP and their two CSMs (adjusted EPS and revenue) and net income. This may or may not have been intentional, but it bears mentioning that it’s tough to equally balance a pure compliance focus and a normative persuasion focus.
IBM Corporation (IBM)
DEF 14A filed 3/6/2023
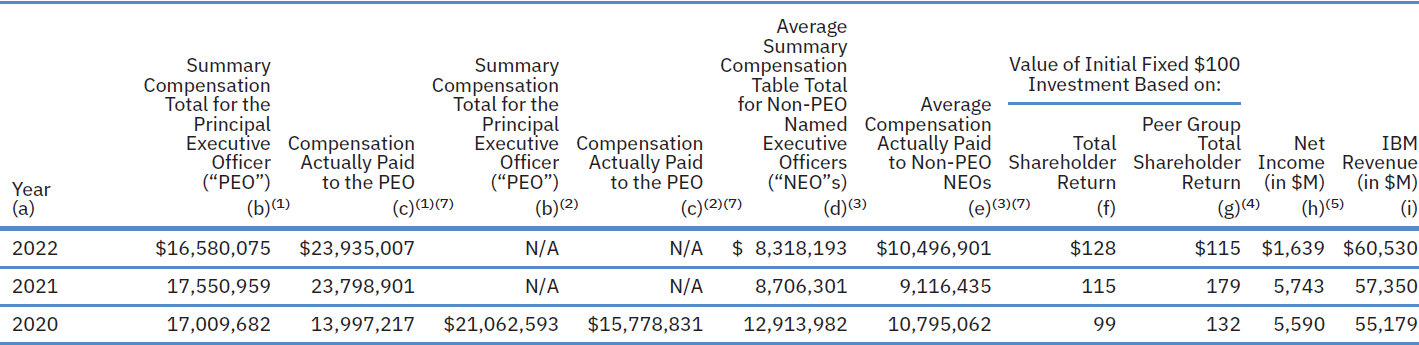
Takis Makridis, President & CEO of
IBM’s disclosure provides a powerful case study on how and why a company may reject the popular approach of graphing for its relationship disclosures. From what we’ve seen so far, less than 10% of companies use a narrative-only approach. We generally like graphing approaches given their relative ease and compliance with the rule.
One benefit to a narrative-only approach is that an inconsistent PvP relationship won’t stick out as much as it will in a graph. IBM’s relationships are not embarrassing, but if they were, a narrative approach may be both fully compliant and draw less attention.
One problem with the narrative-only approach is that the SEC doesn’t provide a bright line as to what’s sufficient. In some respects, narrative prose will simply convert the core table data into words, risking redundancy (a big no-no in the SEC’s plain-English guidance). Analysis of the drivers behind the relationships solves that problem, but too much analysis is cumbersome and tough to roll forward.
As a final interesting point: IBM also provides their breakout of equity adjustments using only footnote text rather than the more typical table format.
Kaman Corporation (KAMN)
DEF 14A filed 3/3/2023
Takis Makridis, President & CEO of
This is a good disclosure amid complexity in the form of multiple PEOs and a complex incentive program.
Let’s look at two interesting dimensions. First, Kaman is another example like IBM that used a narrative-only approach toward the relationship disclosures required by Item 402(v)(5). In one sense, Kaman’s analysis is much more informative than what a graph may provide. However, we struggle more generally with the lack of a bright line by the SEC as to what’s a sufficiently “clear description” of the relationship. Kaman, for example, provides pro forma analysis of what CAP would have been had a severance payment not been made—it’s unclear how that aligns with the SEC’s views on supplemental disclosure.
Second, Kaman, like most companies, does not provide granularity into its valuation assumptions used to remeasure the fair value on its TSR-based awards. Item 402(v)(4) requires disclosure of “any assumption made in the valuation that differs materially from those disclosed as of the grant date of such equity awards.” This is a vague requirement, and an odd one—in the most literal reading, inputs to valuation models must change over time by definition. For example, interest rates today aren’t quite what they were back in 2020!
In practice, we see companies falling somewhere along a spectrum. At one end, some companies are entirely silent. We feel this is aggressive in light of Item 402(v)(4). At the other end, some companies are disclosing the ranges of assumptions used for each valuation input, like volatilities and interest rates. This is aligned with the most literal reading of the rule, but not an interpretation that most companies have taken. In between those ends of the spectrum, we see a majority of companies giving a brief description of how valuation assumptions were derived, how the process was done in accordance with GAAP and the approach does not materially differ from that used at the point of grant, and so on. We are interested to see if industry practice evolves or if the SEC provides further clarity on their expectations on this topic.
Equitrans Midstream Corporation (ETRN)
DEF 14A filed 2/23/2023
Magellan Midstream Partners, L.P. (MMP)
DEF 14A filed 2/21/2023
Our CEO is the principal executive officer (“PEO”). The following table sets forth information concerning the compensation of our PEO(s) and other NEOs for each of the fiscal years (“FY”) ending December 31, 2020, 2021 and 2022 and our financial performance for each such fiscal year:
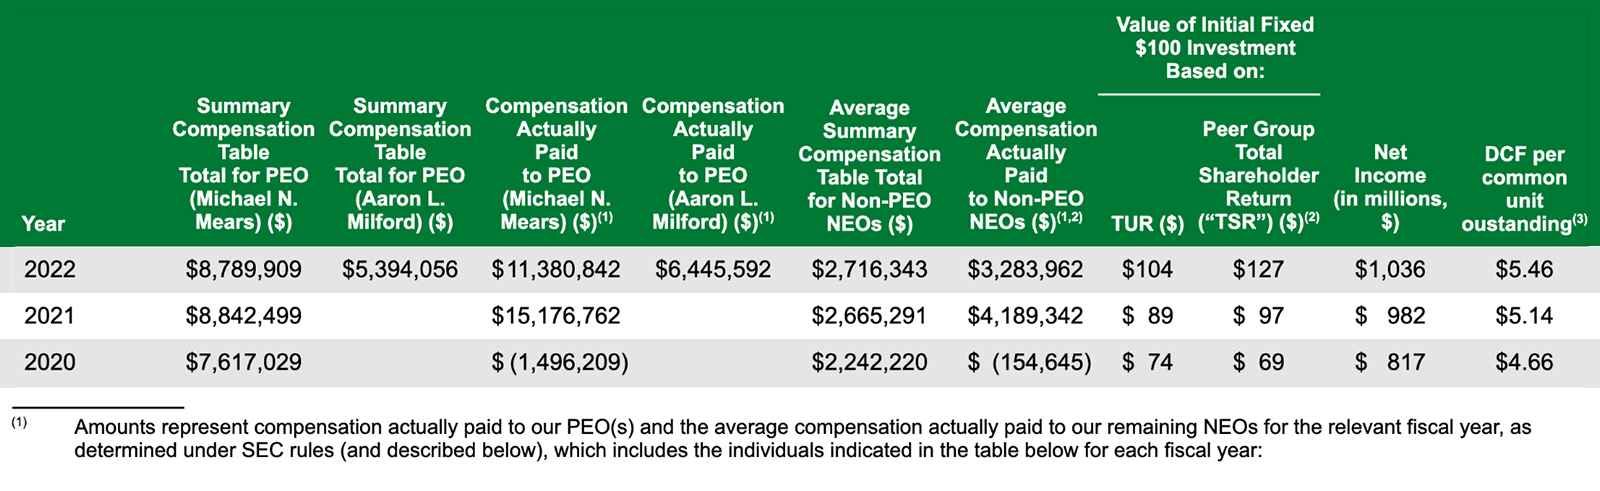
Narrative to Pay Versus Performance Table
For the fiscal year ending December 31, 2022, the most important financial performance measures used to link compensation actually paid to our NEOs to company performance are DCF per unit, DCF and adjusted EBITDA. Our NEO’s target total compensation is heavily weighted towards short and long-term performance with performance goals aligned with our unitholders’ interests. The majority of target compensation was weighted toward long-term equity performance and time-based awards and the sole financial performance metric for LTIP awards was DCF per unit. The short-term incentive program’s funding metric is DCF required to maintain distribution levels from the last quarter in the prior fiscal year and the financial performance metric under our short-term incentive program is Adjusted EBITDA less maintenance capital.

Takis Makridis, President & CEO of
Magellan Midstream Partners took the plunge and published one of the first Pay Versus Performance disclosures on February 21, 2023. This disclosure is well done, especially given numerous moving parts and complexity drivers.
Magellan had two principal executive officers in 2022, which must be reflected in the core pay vs. performance table via an additional column. Their long-term incentive program metric is distributable cash flow per common unit outstanding, which is a classic performance condition under ASC 718. Unsurprisingly, Magellan picked this as their company-selected measure. We expect most companies to use their primary incentive program metric as the company-selected measure since it probably has the closest correlation with changes in compensation actually paid (CAP).
Interestingly, Magellan provides extensive detail as to the payout assumptions applied to this metric in producing CAP. A topic of contention—and a variation in practice—has been how much detail to include in the footnotes regarding the valuation assumptions applied. Many companies have chosen not to provide details. Instead, they merely point out that the assumptions are generally consistent with those used at the point of grant.
We were pleased to see Magellan provide the six-way split of the different sub-components to CAP. The SEC’s recent Compliance & Disclosure Interpretations (C&DIs) clarified this is required. It’s not enough to show the aggregate equity award adjustment that is subtracted from the summary compensation table amount to arrive at CAP.
Magellan chose to use one of its Item 201(e) peer groups to formulate its peer TSR. We expect to see at least 75% of companies take this approach given its relative simplicity and the new ambiguity created in the SEC’s most recent C&DIs.
Magellan relied primarily on graphing to perform their relationship disclosures, which are the “clear descriptions” of the relationship between CAP and each performance measure that Item 402(v)(5) requires. The SEC’s recently released C&DIs allow multiple principle executive officers to be grouped in these particular disclosures, which Magellan chose not to do—it’s unclear whether this was intentional or due to the C&DIs being released so close to Magellan’s filing date. We expect most companies will at least partially rely on graphing since this unambiguously satisfies the disclosure obligation. By contrast, there is not a bright line as to how much narrative text is enough to provide a “clear description."
Finally, Magellan chose to place the disclosure next to CEO pay ratio, something we believe almost all companies will do.
Equilar and Equity Methods have partnered to develop a new Monte Carlo Simulator. This revolutionary new tool helps support companies’ pro forma modeling and planning, enabling them to stay ahead of the curve in preparation for the new SEC Pay Versus Performance rule. To learn more about the Monte Carlo Simulator, visit www.equilar.com/equity-valuation or contact us at info@equilar.com.

Director of Content & Communications at Equilar
Amit Batish, Director of Content & Communications at Equilar, authored this post. Please contact Amit Batish at abatish@equilar.com for more information on Equilar research and data analysis.


Takis Makridis, President & CEO
David Outlaw, Managing Director, Valuation & HR Advisory Services
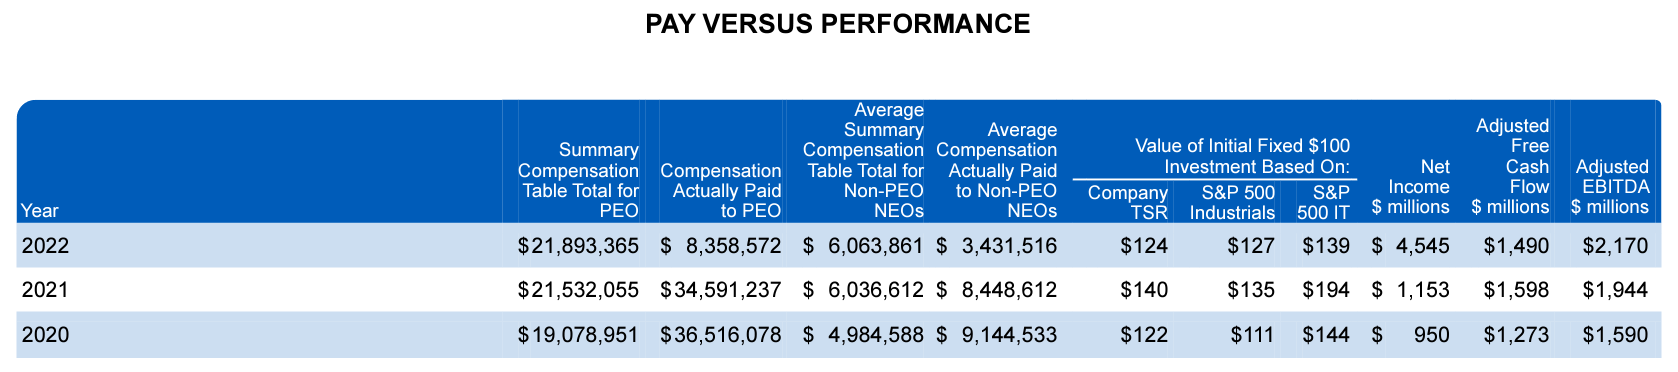
A few notable aspects of Roper’s disclosure jump out. First is their use of two CSMs. They use measures of free cash flow and EBITDA as equally-weighted metrics in their LTIP, so they elected to use both as CSMs in the PvP table. This is allowed under the PvP rule, though we saw other firms elect to simply choose one metric as their CSM and include the other(s) in their tabular list.
This decision reflects a decision point of whether to treat the disclosure as a pure compliance exercise or fit the flow and content to most closely resemble the story in the CD&A. As a compliance exercise, one CSM meets the threshold of the rule. As something more, if there are two equally weighted metrics in the LTIP, then it can naturally make sense to present both as equally important metrics and thus CSMs.
Second, Roper included two different industry indexes for TSR comparison. These two indexes correspond to the two the company uses in their 10-K under item 201(e) of Regulation S-K. Again, the use of two indexes in the PvP table is allowed in these circumstances, but not required.
A final interesting aspect is their use of the relationship disclosure charts to clarify an unusual metric outcome. In particular, they had a sizable spike in GAAP Net Income in 2022 due to the disposition of discontinued operations. To add clarity for investors, they included both that Net Income figure as well as Net Income from Continuing Operations in their chart, painting a more complete picture of the company’s earnings performance.
This discretionary choice illustrates the lack of a bright line surrounding supplemental disclosure. Technically, adding an alternative rendition of net income is a supplemental disclosure, which means it must be clearly labeled as supplemental (and not be misleading or presented more prominently). In Roper’s case, the slight tweak to the relationship chart is wholly benign, but it’s a good reminder to be careful when offering up additional content.