Products
Resources
Company

Investors and proxy advisors alike have become increasingly focused on the rigor and appropriateness of incentive plan targets in addition to metrics. The Company’s board is questioning whether the threshold, target and maximum hurdles set for EPS growth under the annual incentive plan are sufficiently challenging.
IPACSM can help the Company view historical performance for over 150 financial metrics for any group of companies and over any time frame up to 15 years. This will assist the Company in determining whether its incentive plan hurdles are set appropriately. The Target Setting tool shows the cumulative percentage achievement for a variety of summary statistics (e.g., 25%, 50% and 75%) to provide the Company with valuable information when determining how likely it is to achieve certain hurdles, based on past performance of its peers.
For the past two years, the Company’s incentive plan payouts have been above target, reflecting above expected performance on net income and cash flow. But TSR over the same period has significantly lagged the peer group. Because of this “pay for performance disconnect,” investors and proxy advisory firms are critical of the pay design, and the company is at risk of losing its Say on Pay vote.
IPACSM can help this company evaluate the relationship between its current metrics—net income and cash flow—and TSR over multiple time horizons. Depending on the nature of the client’s industry, these metrics may have a stronger relationship over longer time horizons, and as such, they may be appropriate to drive sustainable shareholder value.
IPACSM can conduct these detailed analyses quickly, allowing the Company to easily test different time horizons. It can also help the Company evaluate whether different metrics might be more closely related to changes in TSR, which provides a fact-based approach to the assessment of incentive plan design changes.
The Company requests a meeting with an investor to discuss a planned change in their long-term incentive metric. The Company is planning to move away from return on capital and instead use revenue growth to determine LTIP payouts. The investor is interested to know what other companies in the peer group are using and whether or not there is a difference in how those companies perform.
Using the Metric Prevalence function, the investor can quickly see how many of the company’s peers are using revenue in their long term plan, also going further to test how strong the correlation is between revenue growth and TSR using the Financial Metrics Correlation Analysis function. Finally, using the Long-Term Incentive Plan Effectiveness function, the investor can see at a glance the TSR performance of companies using revenue in their LTI plan.
The Company’s corporate performance metrics for executives are return on invested capital (ROIC) and TSR. The business presidents have the most direct impact on ROIC, so they would like to test whether the current incentive plan metrics for their employees—revenue and operating profit—are correlated to changes in ROIC.
IPACSM can help this company evaluate the relationship between business-specific metrics and overall corporate metrics to help choose the most appropriate metrics for employees at all levels of the organization. The Financial Metric Correlation tool shows the correlation of business-specific metrics to the metric that business unit presidents want to drive—ROIC. This could be valuable information when designing incentive plans for employees within the businesses in order to drive corporate performance.
Both major U.S. proxy advisory firms now include an assessment of a company’s performance against multiple financial metrics in their reports. Companies need to be prepared to respond to criticism of below-par performance on these metrics, even if they have little bearing on their ability to create long-term shareholder value.
Using IPACSM’s Financial Metric Correlation functionality, users can quickly test over 150 financial metrics to assess whether or not they are correlated to long-term changes in shareholder value. So, if a proxy advisory firm bases a pay for performance assessment on a metric with little relationship to shareholder value, companies can refute that assessment with facts.
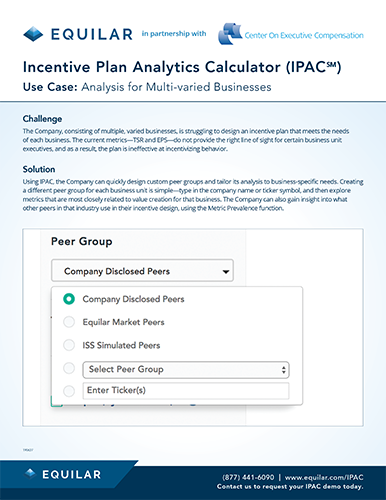
The Company, consisting of multiple, varied businesses, is struggling to design an incentive plan that meets the needs of each business. The current metrics—TSR and EPS—do not provide the right line of sight for certain business unit executives, and as a result, the plan is ineffective at incentivizing behavior.
Using IPACSM, the Company can quickly design custom peer groups and tailor its analysis to business-specific needs. Creating a different peer group for each business unit is simple—type in the company name or ticker symbol, and then explore metrics that are most closely related to value creation for that business. Using the Metric Prevalence, the Company can also gain insight into what other peers in that industry use in their incentive design.
A new member of the Company’s board is advocating a change to its annual incentive plan metric from operation income to return on capital and says that “every one of our competitors is using it, so we should be using it as well.
Within minutes, IPACSM can provide a fact-based answer to the question of what metrics are common among the company’s peers. Through the Metric Prevalence function, IPACSM displays, by peer company, the metrics used in each company’s short and long-term incentive plans.


-180227.png)

-180227.png)
-180227.png)

-180227.png)
-180227.png)

-180227.png)