Equilar Institute
Blog Home
P&G Proxy Fight: Trian Pushes to Reevaluate Executives’ Incentive Compensation Goals

September 29, 2017
A conclusion to the proxy fight between Procter & Gamble (P&G) and Trian Partners (Trian) is approaching, as shareholders are scheduled to vote their shares at the company’s annual meeting on October 10—if the two sides don’t reach a resolution before then. Earlier in September, Trian published a comprehensive presentation that outlined its rationale for seeking a board seat at P&G and its proposals to grow the value of the company. According to Martin Lipton, a founding partner of Wachtell, Lipton, Rosen & Katz, Trian’s proposal is unique for an activist investor in several ways, including the absence of a call for break-up of P&G and the fact that Trian is not “seeking to cut pensions, reduce CAPEX, reduce R&D or reduce marketing expenses.”
Trian also expressed its lack of desire to make additional changes to management or the board, and only seeks one board seat for senior partner Nelson Peltz. (Equilar also recently conducted an analysis on how a Peltz appointment may impact P&G’s board of directors.)
The remainder of Trian’s proposal focuses on regaining market share for P&G’s brands, optimizing operational efficiencies and strengthening corporate governance while shifting to a longer-term growth outlook. But in particular, Trian criticized the company’s performance over the long-term (trailing 10-year shareholder returns) and outsized executive compensation packages for senior management relative to declining market share. Equilar conducted an analysis of pay and performance alignment over a shorter time horizon of three years relative to P&G’s proxy-disclosed peer group* in order to further examine Trian’s concerns and offer additional context. The results follow.
P&G Pay and Performance vs. Peers
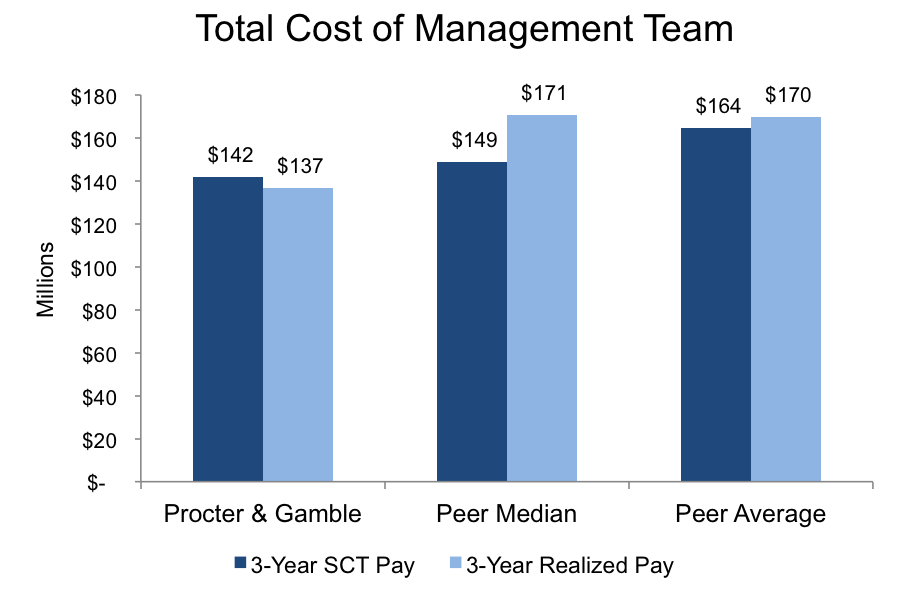
The total cost of P&G’s management team—or the sum of its executive’s total compensation—fell below the median of its peers for the three-year study period. This includes the sum of total compensation reported in the summary compensation table (SCT) for proxy-disclosed named executive officers (NEOs) as well as realized, or “take home,” pay. In aggregate, P&G reported $142 million in total SCT pay for its NEOs (excluding change in pension value and non-qualified deferred compensation earnings), while these executives earned $137 million in realized pay according to Equilar data. P&G’s three-year SCT pay was at about the 40th percentile of its peers; meanwhile, realized pay for the same executives fell closer to the 25th percentile, as the company’s peer medians were $149 million and $171 million, respectively. (Peer averages were $164 million and $170 million.)
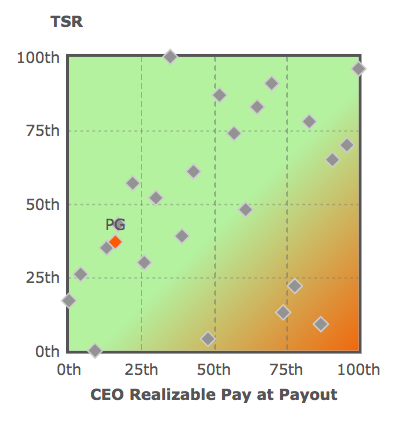
On a relative basis as measured by total shareholder return (TSR) and CEO realizable pay at payout, P&G avoids the investor “red zone,” where pay relative to peers far outpaces the relative performance ranking, according to the Equilar pay-for-performance profile. Indeed, P&G’s TSR performance (37th percentile) outranks its CEO pay (16th percentile) relative to proxy peers on this front.
Three-Year TSR vs. CEO Realizable Pay at Payout Alignment – P&G vs. Proxy Peers
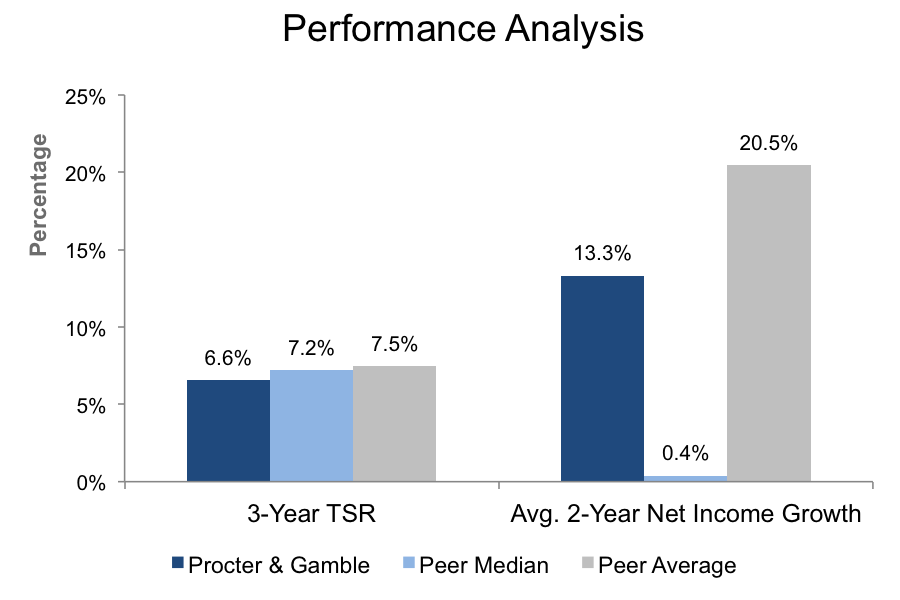
In a separate analysis of TSR on an absolute basis, Equilar found that measured over a trailing three-year period, P&G’s TSR of 6.6% fell below both its peer median and average, which were 7.2% and 7.5%, respectively. Averaging the past two year-over-year growth periods, Equilar found that on average, P&G’s net income—a measure of corporate profits—grew by 13.3%, compared to the peer median 0.4%. It’s worth noting that the peer average was 20.5% net income growth, bolstered by companies like GE and Ford (244% and 231%, respectively), and there was a wide range of results. Many companies were also above 30% net income growth, and on the low end, Chevron saw a 94% decline as a two-year average. Based on these two measures, examined over the past three fiscal years, P&G’s performance relative to peers fell at the 37th percentile for TSR and the 70th percentile for net income growth.
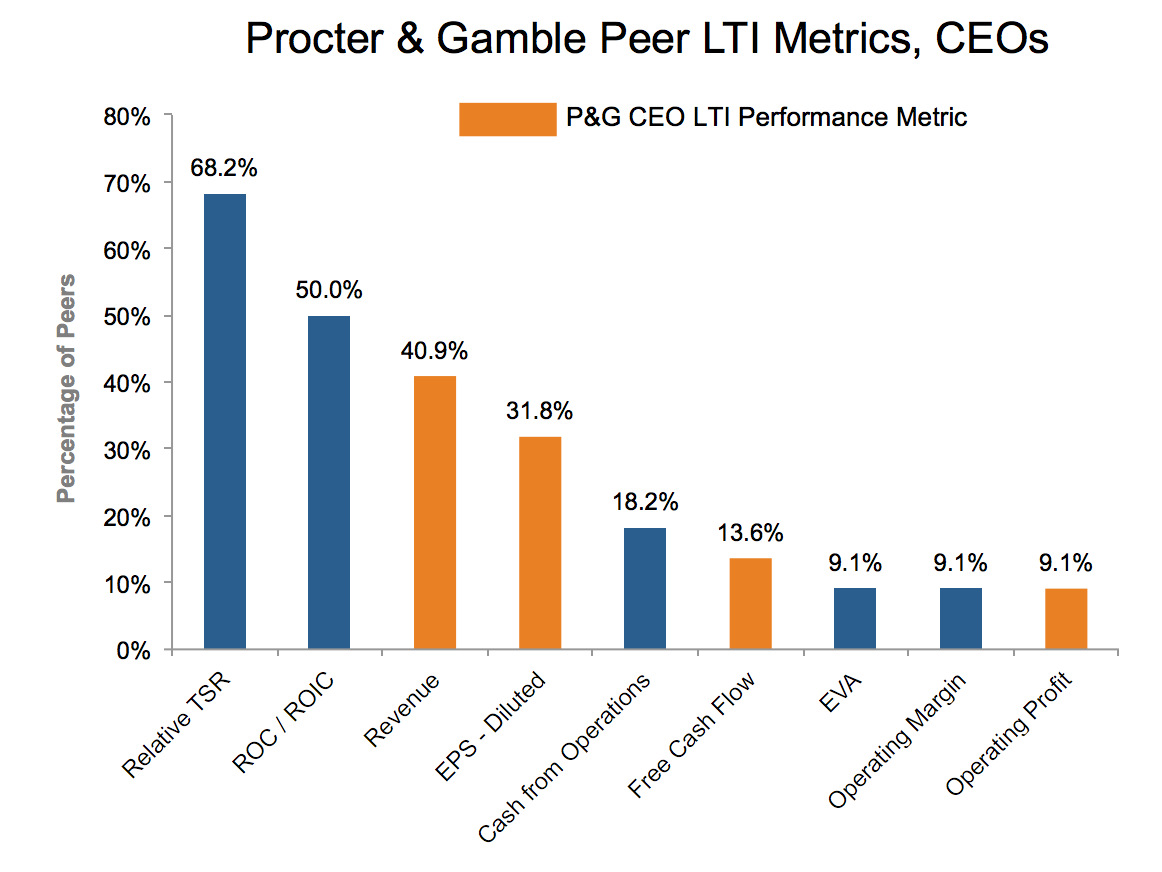
P&G Long-Term Incentive Mix and Performance Metrics Compared to Peers
Trian’s primary disclosed issues with P&G’s executive compensation practices focus on two areas: 1) full annual bonus payouts despite earnings per share (EPS) growth in the bottom quartile compared to peers, and 2) absence of incentive metrics that measure performance relative to peers. Trian believes management’s incentive goals have not been set at adequately high targets, and proposes to align compensation with market share gains. Trian also expressed concern that management compensation has been bolstered by time-vesting restricted stock and options awards.
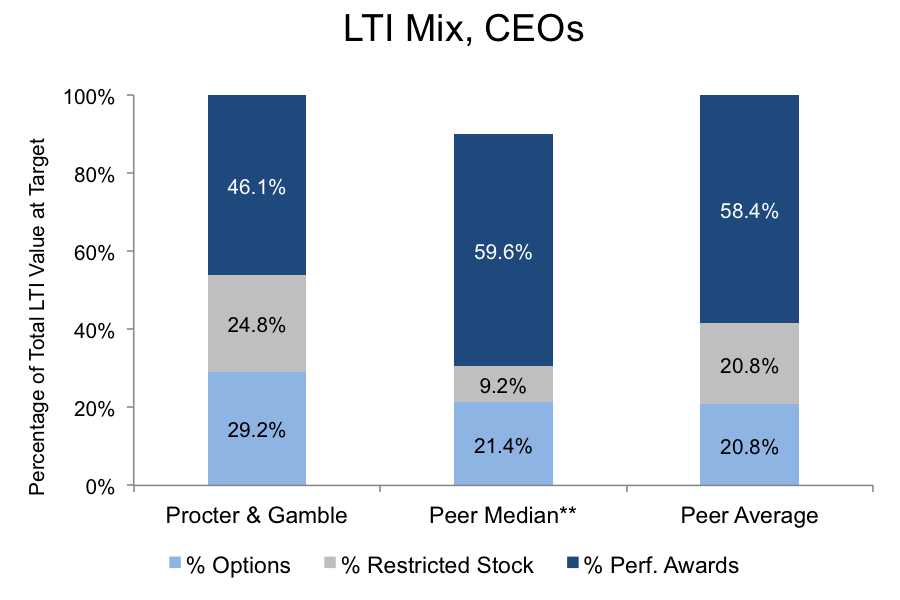
To address that final point, Equilar calculated the LTI mix at targeted values and found that about 46% of total long-term incentives are allocated to performance-contingent awards for P&G’s CEO in the most recently reported fiscal year. In contrast, total LTI mix was delivered in performance awards to P&G’s peer CEOs at 59.6% and 58.4% at the median and average, respectively. Time-vesting awards in the form of stock options and restricted stock were given greater weight at P&G compared to the peer median and average. To put these numbers in context, proxy advisor guidelines recommend at least 50% of the total CEO LTI mix be allocated to performance-based awards. At least 60% of the CEOs heading the largest 500 U.S. public companies (by revenue) receive a minimum 50% of total LTI target value in performance awards, as reported by Equilar in Equity Compensation Trends.
As previously mentioned, Trian’s concerns with P&G’s long-term incentive structure centers, in part, on its view that time-vesting awards are over-weighted in the total LTI mix, and that relative performance metrics are absent from the long-term plan. P&G leverages revenue, EPS, cash flow and operating profit metrics for its CEO’s performance-contingent LTI awards, according to the Equilar Incentive Plan Analytics Calculator (IPAC) database. Near or greater than one-third of its peers that grant performance LTI link long-term awards to revenue- or EPS-based metrics. Moreover, about 68% utilize TSR measured relative to a peer group or index (rTSR) in their CEOs’ long-term plans. About 50% of large-cap CEOs saw rTSR tied to LTI grants in fiscal 2016, a value that remained unchanged from 2015 after a seven percentage point spike from five years prior, according to Equilar research published earlier this year.
Return on capital (ROC)—inclusive of return on invested capital—also experienced strong growth in executive pay plans since 2012, rising seven percentage points to 35% of large-cap CEOs in 2016, bolstered by strong investor sentiment and support for the metric, according to research by Argyle Research and the Stanford Graduate School of Business. Half of P&G’s peers include ROC in their CEOs’ performance LTI, though it’s absent from P&G’s plan. Notably, P&G leveraged EPS metrics for long-term awards. Trian criticized P&G for EPS growth performance in the bottom quartile of its peer group.
*P&G proxy-disclosed peers (24 companies): 3M Co, AT&T Inc., Boeing Co, Chevron Corp, Coca-Cola Co, Colgate Palmolive Co, Exxon Mobil Corporation, Ford Motor Co, General Electric Co, Home Depot Inc., HP Inc., IBM Corp, Johnson & Johnson, Kimberly Clark Corp, Lockheed Martin Corp, Merck & Co. Inc., Microsoft Corporation, Mondelez International, Inc., Nike Inc., Pepsico Inc., Pfizer Inc., United Technologies Corp, Verizon Communications Inc., Wal-Mart Stores Inc.
**Calculated medians sum to less than 100% unadjusted. Adjusted values are: % Options – 23.7%, % Restricted Stock – 10.2%, % Perf. Awards – 66.1% (sum = 100%)
Request a demo of Equilar Shareholder Engagement and P4P solutions or IPACSM at https://www.equilar.com/IPAC.html or email info@equilar.com to learn more.
Matthew Goforth, Senior Governance Advisor at Equilar, authored this post. Please contact Dan Marcec, Director of Content & Communications, at dmarcec@equilar.com for more information on Equilar research and data analysis.